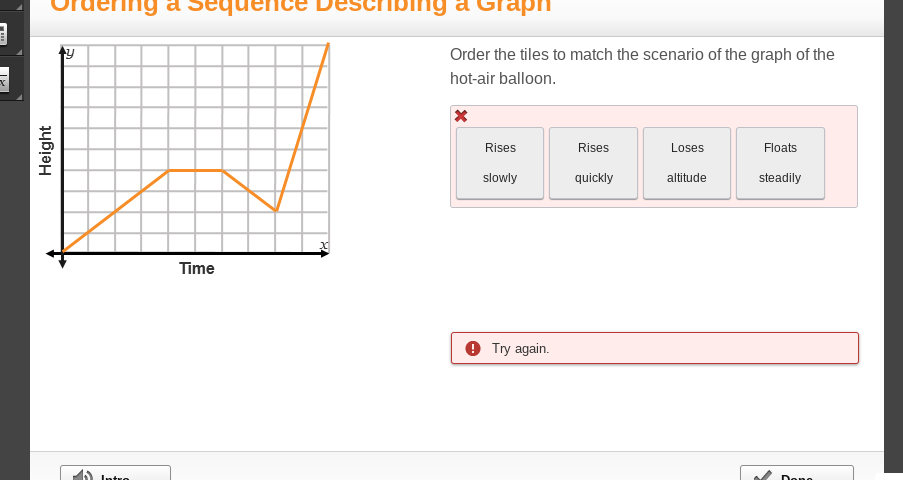
Order the tiles to match the scenario of the graph of the hot-air balloon.

Understand the Problem
The question is asking to order the tiles in a way that represents the scenario shown in the graph of a hot-air balloon, describing its height over time.
Answer
'Rises slowly,' 'Floats steadily,' 'Loses altitude,' 'Rises quickly.'
The tiles should be ordered as: 'Rises slowly,' 'Floats steadily,' 'Loses altitude,' 'Rises quickly.'
Answer for screen readers
The tiles should be ordered as: 'Rises slowly,' 'Floats steadily,' 'Loses altitude,' 'Rises quickly.'
More Information
The graph's shape provides key indicators for each tile: rising sections indicate gaining altitude, flat sections imply floating, and falling sections suggest losing altitude.
Tips
Ensure to match the graph segments accurately with the tile descriptions.
AI-generated content may contain errors. Please verify critical information