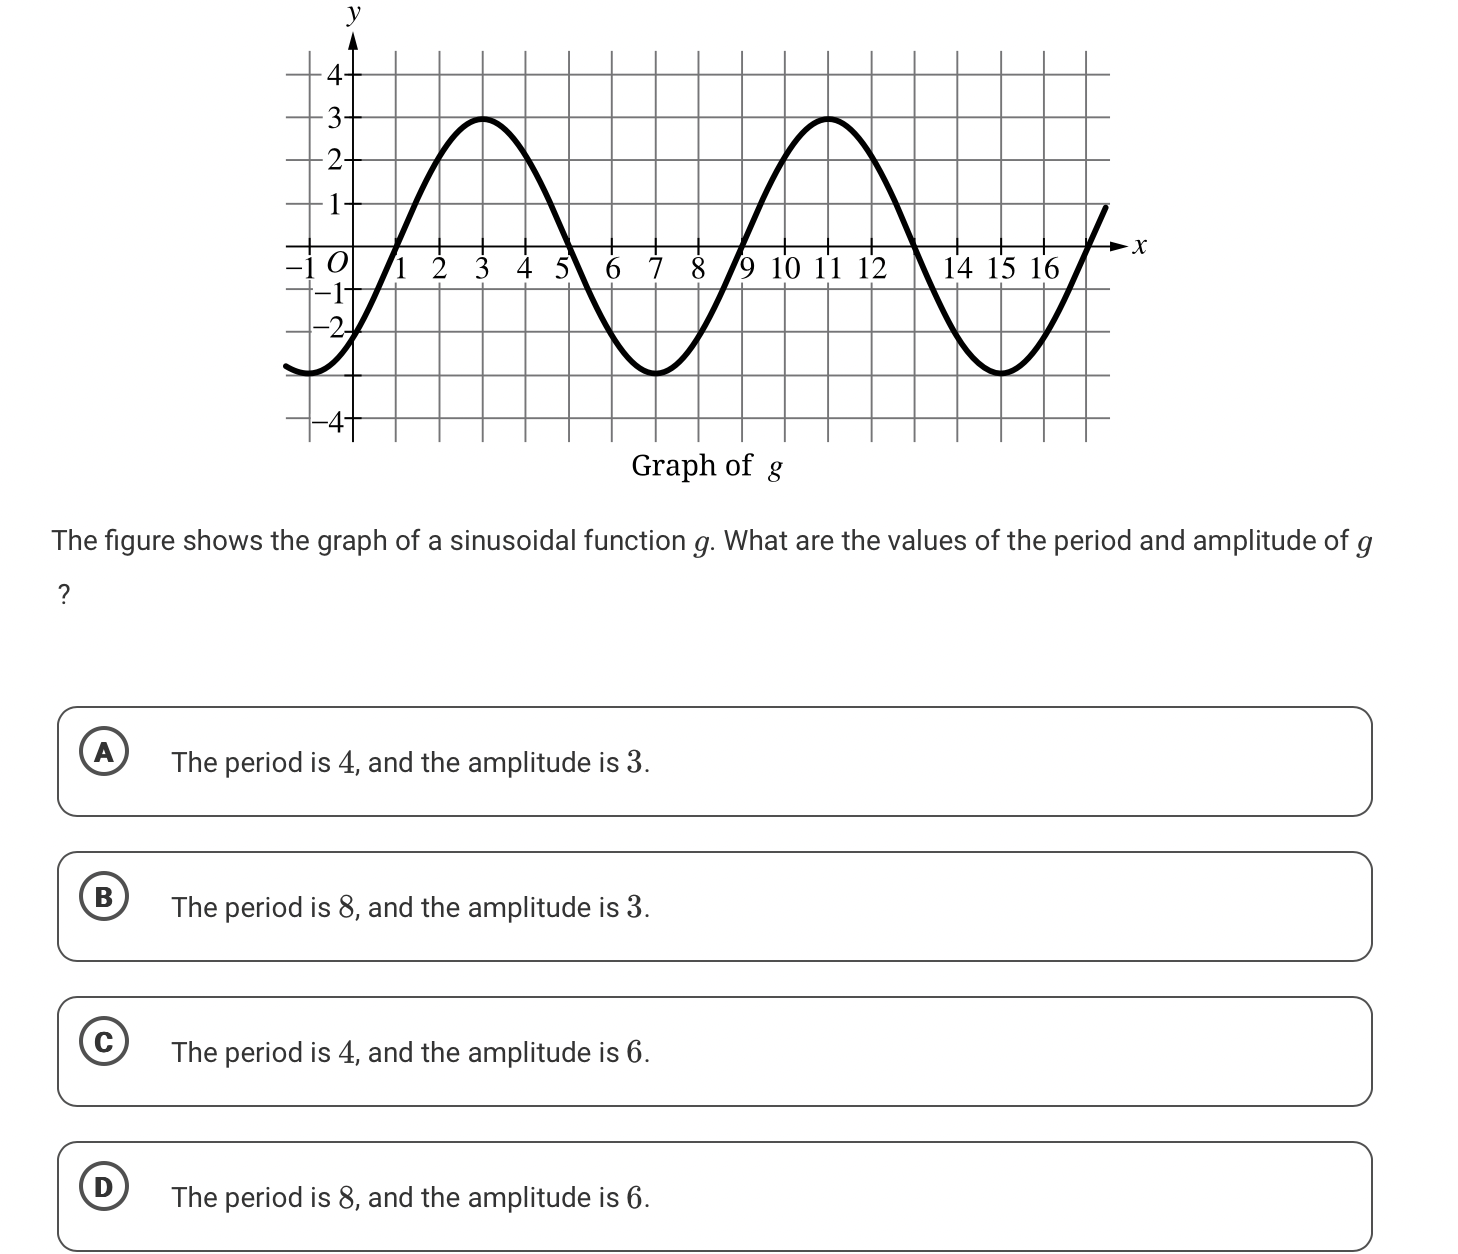
The figure shows the graph of a sinusoidal function g. What are the values of the period and amplitude of g?

Understand the Problem
The question is asking to identify the period and amplitude of the sinusoidal function g shown in the graph. This involves analyzing the graph to determine how long it takes for the function to complete one cycle (the period) and its maximum displacement from the center line (the amplitude).
Answer
The period is \( 8 \), and the amplitude is \( 3 \).
Answer for screen readers
The period is ( 8 ), and the amplitude is ( 3 ).
Steps to Solve
- Identify the Period To find the period of the sinusoidal function, look for the horizontal distance it takes for the function to complete one full cycle. From the graph, note the x-values where the wave starts repeating.
For instance, if the wave starts at ( x = 0 ) and returns to the same starting point at ( x = 8 ), the period is ( 8 ).
- Determine the Amplitude The amplitude of the function is the vertical distance from the middle of the wave (the centerline) to its highest point.
From the graph, identify the maximum and minimum values of the function. If the highest point is ( 3 ) and the lowest point is ( -3 ), the amplitude can be calculated as: [ \text{Amplitude} = \text{Maximum Value} - \text{Centerline} = 3 - 0 = 3 ] or equivalently, since the centerline is at ( 0 ): [ \text{Amplitude} = | \text{Maximum Value} | = 3 ]
- Final Values Combine the results of the above calculations. The period is ( 8 ) and the amplitude is ( 3 ).
The period is ( 8 ), and the amplitude is ( 3 ).
More Information
The period indicates how long it takes for the function to repeat itself, while the amplitude describes the height of the wave. In this case, the function exhibits symmetry about the horizontal axis, confirming that the values accurately represent a sinusoidal function.
Tips
- Confusing the maximum height with the amplitude. Remember that amplitude is the distance from the centerline to the maximum or minimum, not just the height itself.
- Misreading the graph and not accurately identifying the x-values for one full cycle.
AI-generated content may contain errors. Please verify critical information