Understand the Problem
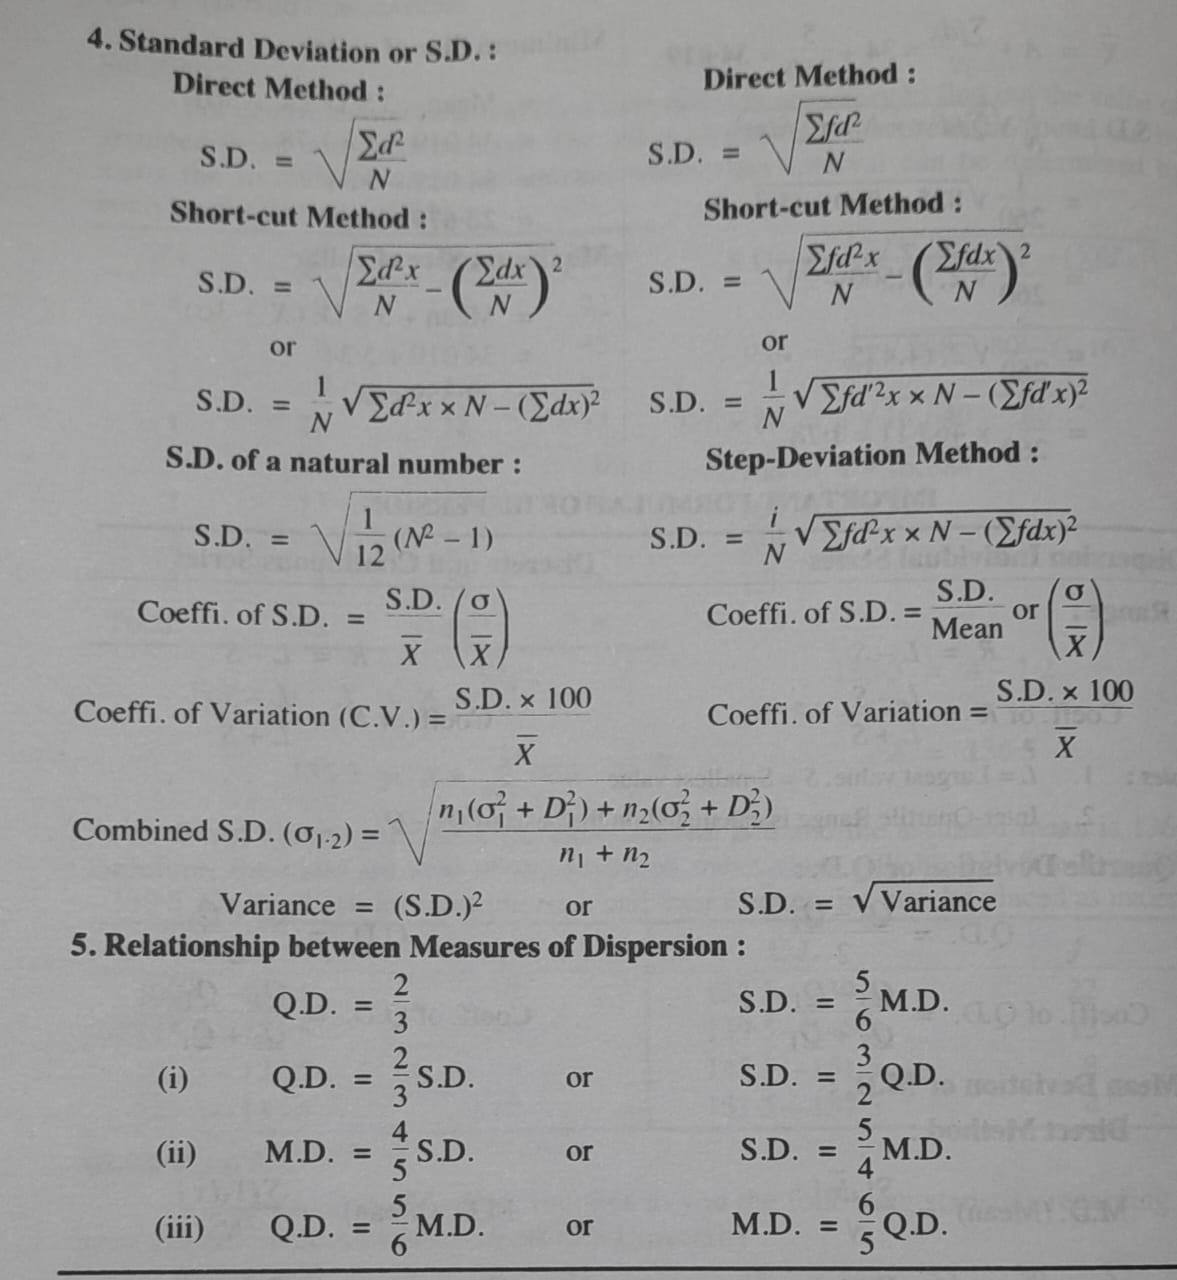
The image provides formulas and methods for calculating the standard deviation (S.D.) using various approaches including direct, shortcut, and step-deviation methods. It also discusses the coefficient of standard deviation, coefficient of variation, and relationships among measures of dispersion.
Answer
S.D. formulas: Direct $S.D. = \sqrt{\frac{\sum d^2}{N}}$; Short-cut $S.D. = \sqrt{\frac{\sum dx}{N}^2 - \left(\frac{\sum dx}{N}\right)^2}$; Step-Deviation $S.D. = \frac{i}{N} \sqrt{\sum fd^2 \cdot x - \left(\sum fd\right)^2}$.
Answer for screen readers
The formulas to calculate Standard Deviation (S.D.) and their relationships are summarized.
Steps to Solve
- Retrieve Relevant Formulas
Identify the relevant formulas for calculating Standard Deviation (S.D.) based on the given methods (Direct, Short-cut, and Step-Deviation).
- Direct Method Calculation
To calculate S.D. using the direct method, use the formula: $$ \text{S.D.} = \sqrt{\frac{\sum d^2}{N}} $$ where ( N ) is the total number of data points, and ( \sum d^2 ) is the sum of the squares of deviations from the mean.
- Short-cut Method Calculation
For the short-cut method, use the formula: $$ \text{S.D.} = \sqrt{\frac{\sum dx}{N}^2 - \left(\frac{\sum dx}{N}\right)^2} $$
- Step-Deviation Method Calculation
In the step-deviation method, the formula is: $$ \text{S.D.} = \frac{i}{N} \sqrt{\sum fd^2 \cdot x - \left(\sum fd\right)^2} $$ where ( i ) is the class interval.
- Coefficient of Variation Calculation
To find the Coefficient of Variation (C.V.), utilize: $$ \text{C.V.} = \frac{\text{S.D.}}{\bar{X}} \times 100 $$ where ( \bar{X} ) is the mean.
- Relationship Between Measures of Dispersion
Use the relationships provided in the image to relate different measures of dispersion, such as:
- ( Q.D. = \frac{2}{3} \text{S.D.} )
- ( M.D. = \frac{5}{4} \text{S.D.} )
The formulas to calculate Standard Deviation (S.D.) and their relationships are summarized.
More Information
Understanding the Standard Deviation is crucial as it measures the amount of variation or dispersion in a set of values. It is widely used in statistics and indicates how much individual data points differ from the mean.
Tips
- Confusing the relationships between measures of dispersion; ensure you utilize the correct coefficients.
- Miscalculating the sums; be careful when summing up deviations or squaring them.
AI-generated content may contain errors. Please verify critical information