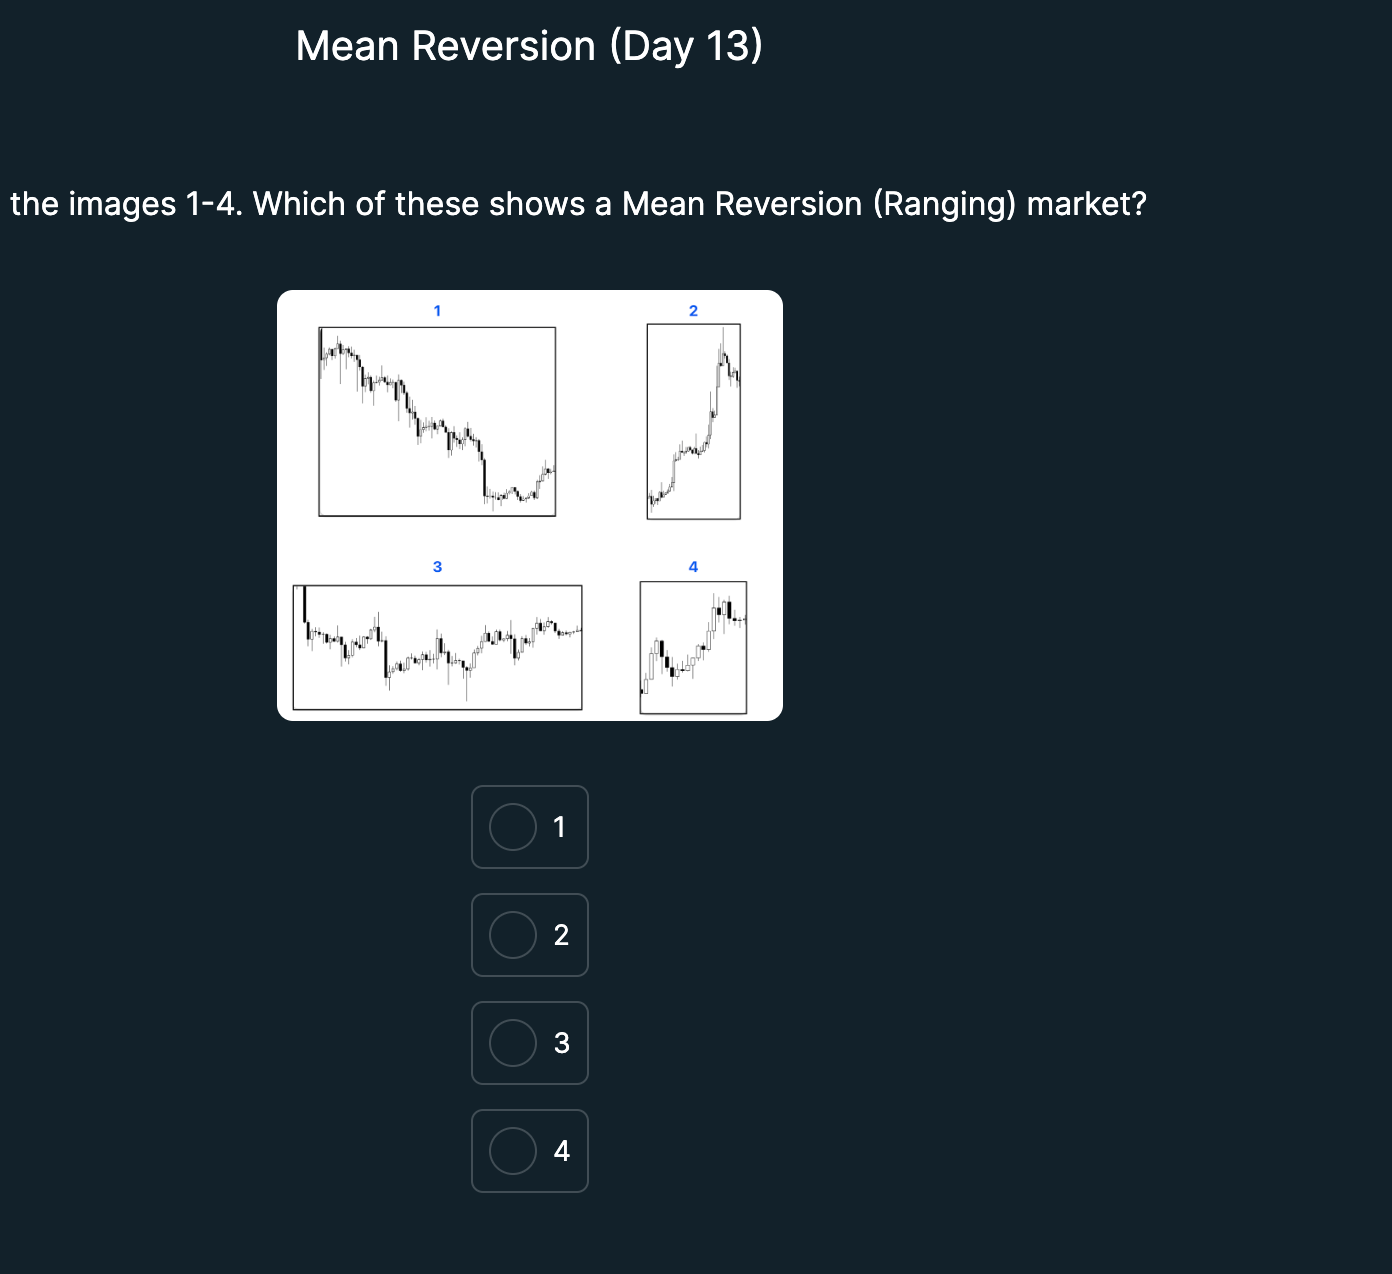
Look at the images 1-4. Which of these shows a Mean Reversion (Ranging) market?

Understand the Problem
The question is asking which of the provided images (1-4) depicts a Mean Reversion market, specifically looking for a ranging market pattern among the charts.
Answer
3
The final answer is 3.
Answer for screen readers
The final answer is 3.
More Information
Mean reversion suggests that asset prices tend to return to their mean or average levels over time. A ranging market shows price levels bouncing back and forth within a range, indicative of mean reversion.
Tips
Common mistakes include confusing trending markets with ranging markets. In the latter, prices fluctuate within a specific range.
Sources
- What Is Mean Reversion, and How Do Investors Use It? - Investopedia - investopedia.com
- Mean Reversion: Trading Strategies & Indicators | CMC Markets - cmcmarkets.com
- Mean Reversion in Time Series - QuantInsti Blog - blog.quantinsti.com
AI-generated content may contain errors. Please verify critical information