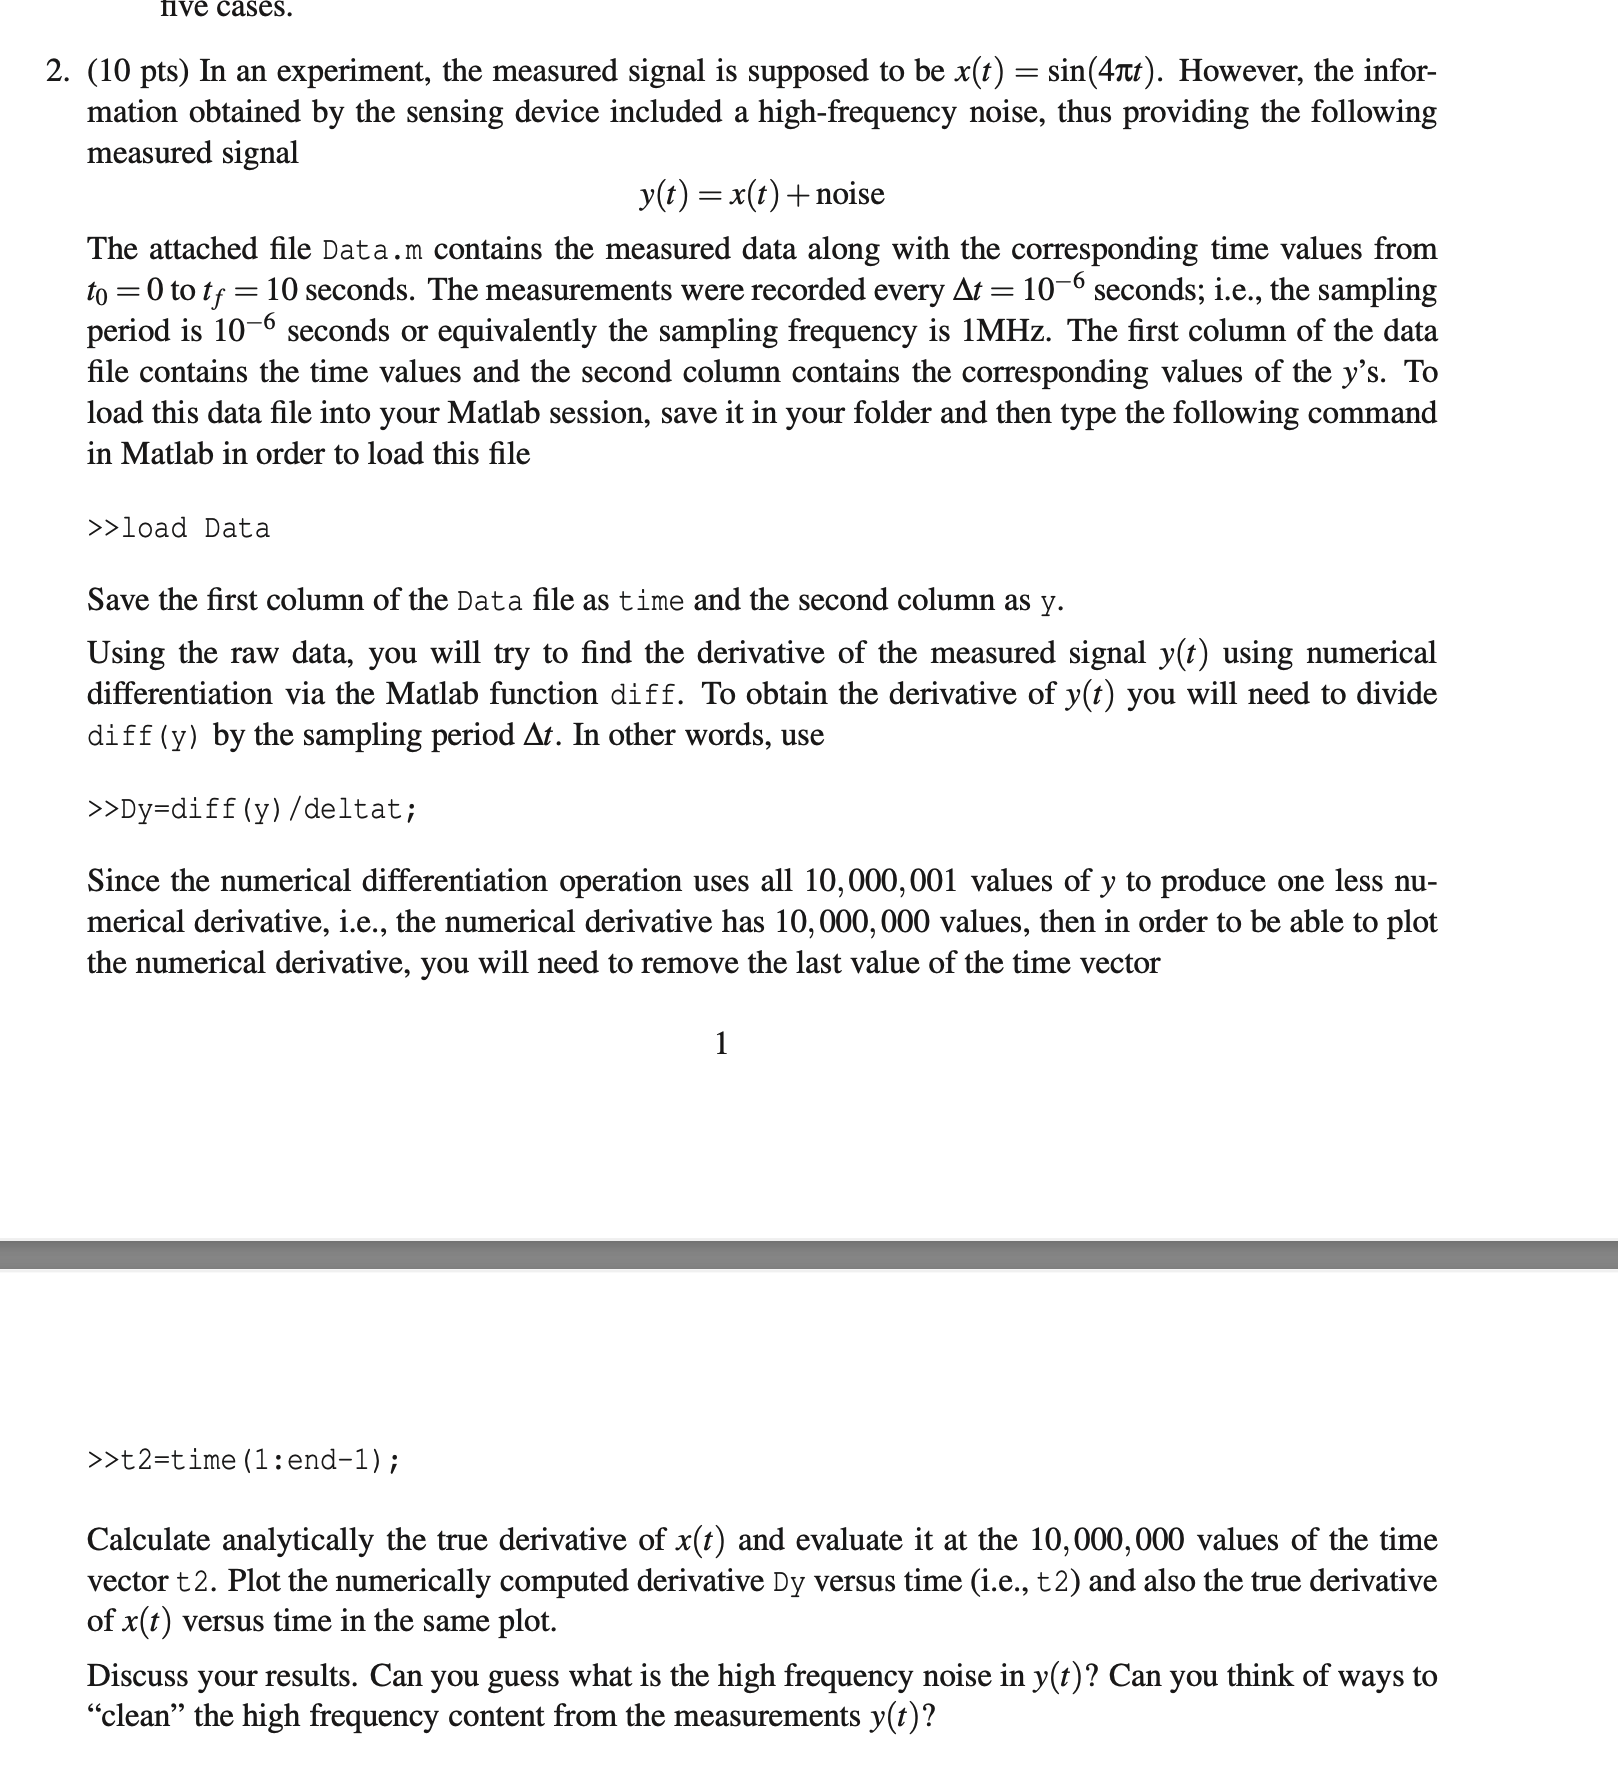
In an experiment, the measured signal is supposed to be x(t) = sin(4πt) + noise. Given the MATLAB data file Data.m containing time values and corresponding y values, calculate the... In an experiment, the measured signal is supposed to be x(t) = sin(4πt) + noise. Given the MATLAB data file Data.m containing time values and corresponding y values, calculate the numerical derivative of y(t) and compare it to the true derivative of x(t). Discuss the challenges of high-frequency noise in the measurements.

Understand the Problem
The question involves analyzing a measured signal affected by noise, computing its numerical derivative using MATLAB, comparing it to the true derivative, and discussing potential ways to reduce high-frequency noise.
Answer
The computed numerical derivative is compared with the true derivative $x'(t) = 4\pi \cos(4\pi t)$.
Answer for screen readers
The numerical derivative $\frac{d y(t)}{d t}$ is computed and plotted alongside the true derivative $x'(t) = 4\pi \cos(4\pi t)$ versus time.
Steps to Solve
- Loading the Data Load the data file into MATLAB. Use the command:
load Data
This will import the time and measured signal y(t) from the file into two variables.
-
Extracting Time and Signal
Assign the first column of the data to
timeand the second column toy. You can do this with:
time = Data(:, 1);
y = Data(:, 2);
-
Calculating the Numerical Derivative
Compute the numerical derivative of
yusing thedifffunction, dividing by the sampling interval $\Delta t$. This is done with:
Dy = diff(y) / deltat;
Here, deltat is specified as $10^{-6}$ seconds.
-
Adjusting the Time Vector
Since
Dyhas one less element thany, create a new time vectort2to match the size ofDy:
t2 = time(1:end-1);
-
Calculating the True Derivative The true derivative can be calculated by differentiating the original function $x(t) = \sin(4\pi t)$. The derivative is: $$ x'(t) = 4\pi \cos(4\pi t) $$ Evaluate this derivative over the time vector
t2. -
Plotting the Results Use the
plotfunction to visualize both the numerically computed derivative and the true derivative:
plot(t2, Dy, 'r', t2, true_derivative, 'b');
legend('Numerical Derivative', 'True Derivative');
xlabel('Time (s)');
ylabel('Derivative');
title('Comparison of Numerical and True Derivative');
- Discussing High-Frequency Noise Analyze the results visually. High-frequency noise can appear as rapid fluctuations in the numerical derivative. Consider techniques such as low-pass filtering to reduce the high-frequency noise.
The numerical derivative $\frac{d y(t)}{d t}$ is computed and plotted alongside the true derivative $x'(t) = 4\pi \cos(4\pi t)$ versus time.
More Information
In this problem, the numerical differentiation is highly sensitive to noise, which makes accurate interpretation of the calculated derivative challenging. Analytical differentiation provides a cleaner signal to compare against.
Tips
- Forgetting to remove the last element from the time vector when calculating the numerical derivative.
- Not properly specifying or assigning the sampling interval $\Delta t$.
- Overlooking the effects of noise on the derivative calculation.
AI-generated content may contain errors. Please verify critical information