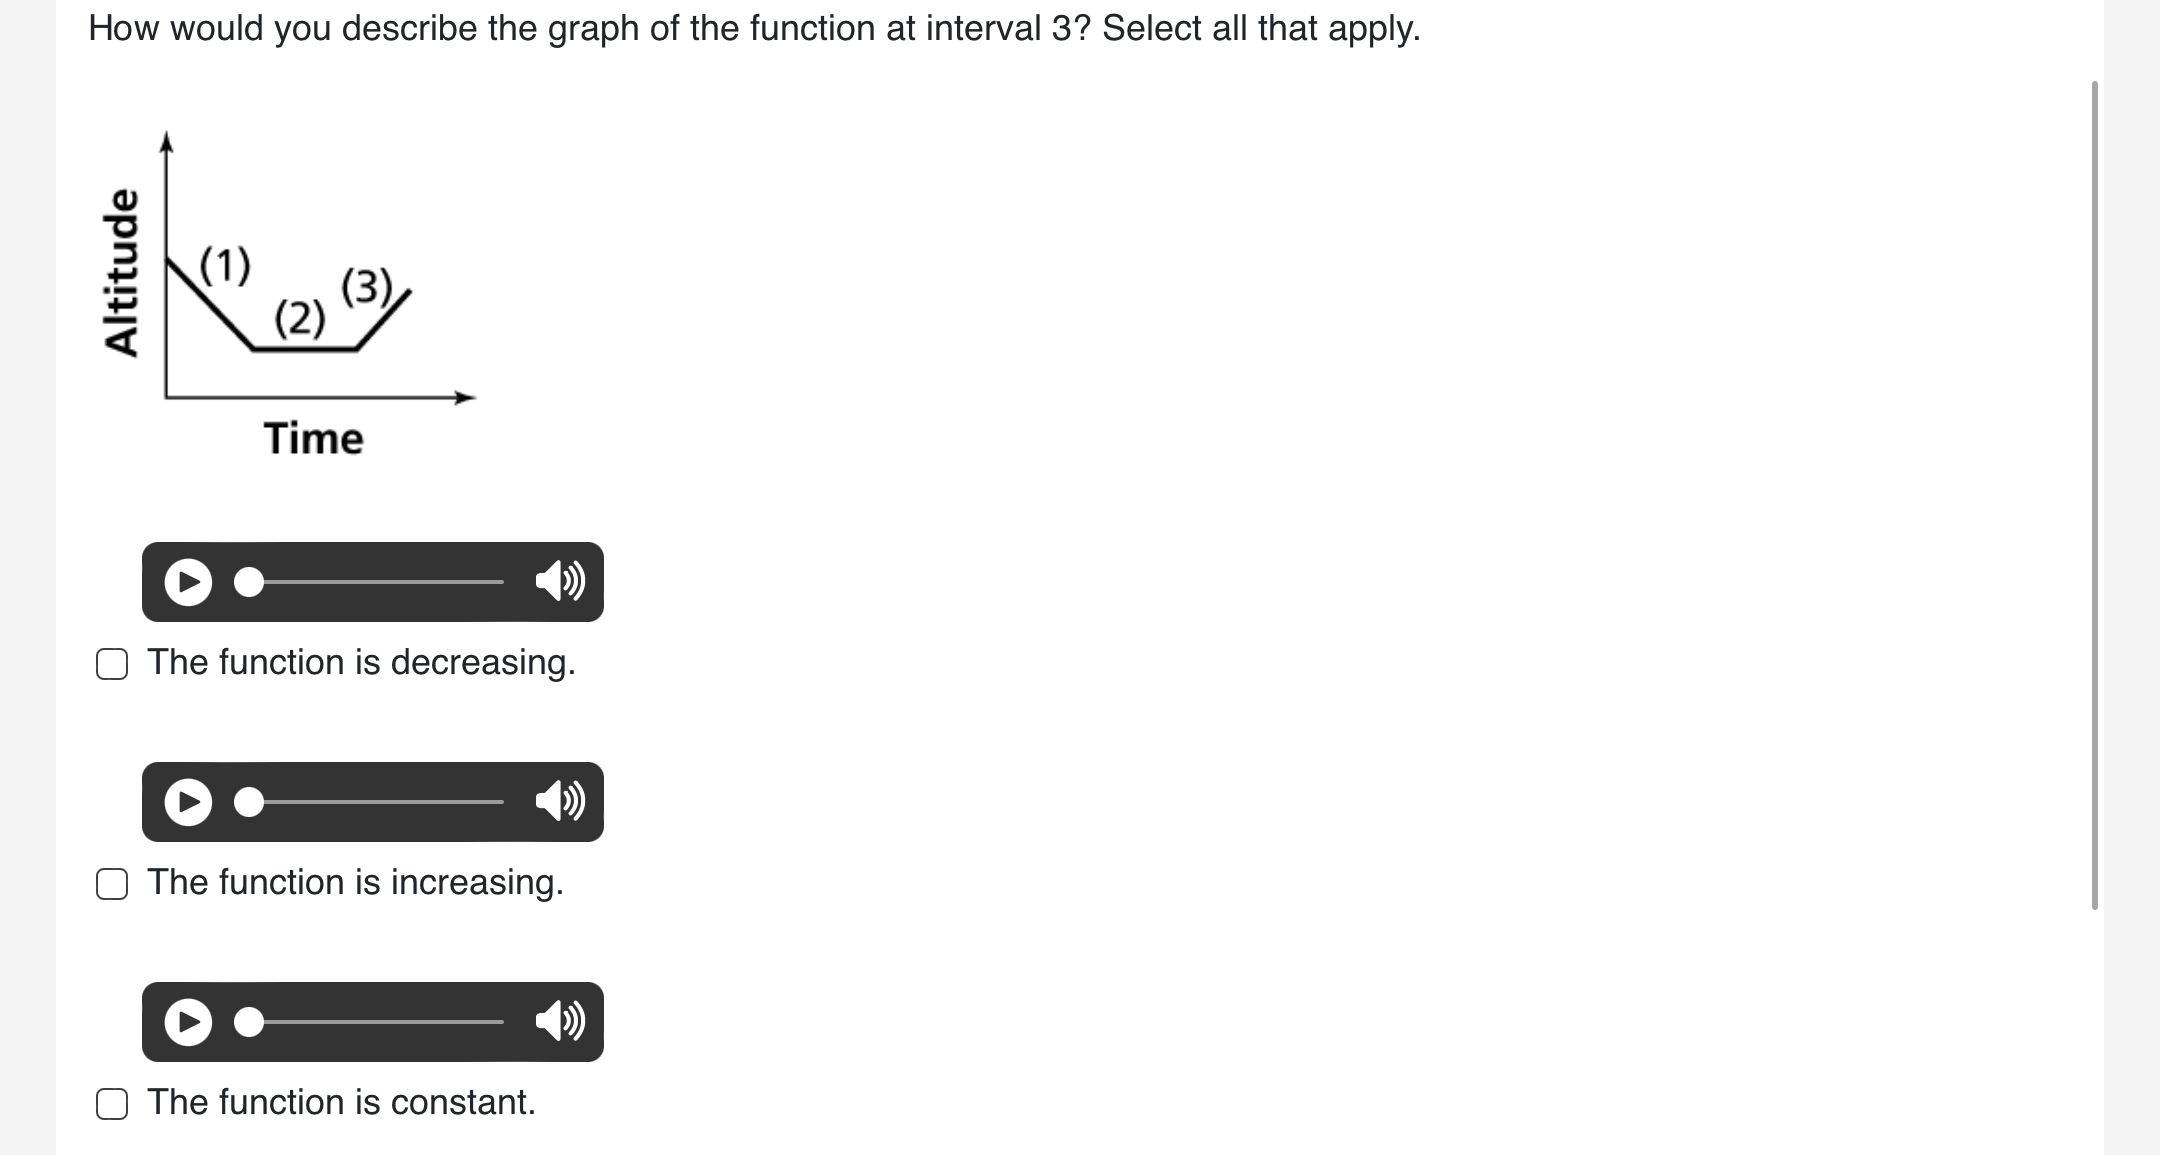
How would you describe the graph of the function at interval 3? Select all that apply.

Understand the Problem
The question is asking for a description of the behavior of a graph at a specific interval (interval 3) regarding whether the function is decreasing, increasing, or constant.
Answer
The function is increasing.
Answer for screen readers
The function is increasing.
Steps to Solve
-
Identify the intervals
The graph is segmented into intervals labeled (1), (2), and (3). We need to focus on the behavior during interval (3). -
Observe the graph behavior in interval (3)
Look closely at the graph during interval (3). It shows a line that is inclined upwards, indicating that the function is increasing. -
Determine the behavior from the graph
At interval (3), since the line ascends, we confirm that the function is increasing. -
Check other options
For intervals (2) and (3), check if they suggest that the function is decreasing or constant. Since we established that in interval (3) the function is increasing, these options don't apply.
The function is increasing.
More Information
In this context, when we say the function is increasing, it means that as time progresses, the altitude is rising. This indicates a positive change in height over that interval.
Tips
- Confusing increasing with decreasing. Make sure to look at the direction of the line; ascending lines indicate an increase.
- Not checking the specific interval mentioned in the question. Focus on the exact interval being asked.
AI-generated content may contain errors. Please verify critical information