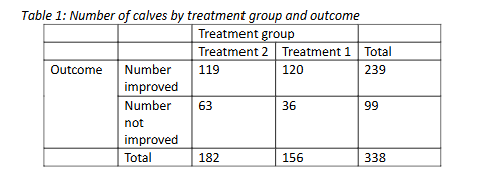
How do I analyze the data in the table regarding the number of calves by treatment group and outcome?

Understand the Problem
The question is likely asking how to analyze or interpret the data presented in the table regarding the treatment of calves and their outcomes.
Answer
65.38% improved in Treatment 2, 76.92% in Treatment 1.
For Treatment 2, 65.38% improved, while for Treatment 1, 76.92% improved.
Answer for screen readers
For Treatment 2, 65.38% improved, while for Treatment 1, 76.92% improved.
More Information
Higher improvement in Treatment 1 suggests it may be more effective. Assessing group sizes and confidence intervals can enhance analysis.
Tips
Focusing only on absolute numbers without considering total group size can lead to misleading interpretations.
Sources
- Cow-Calf Standardized Performance Analysis (SPA) - extension.okstate.edu
AI-generated content may contain errors. Please verify critical information