Understand the Problem
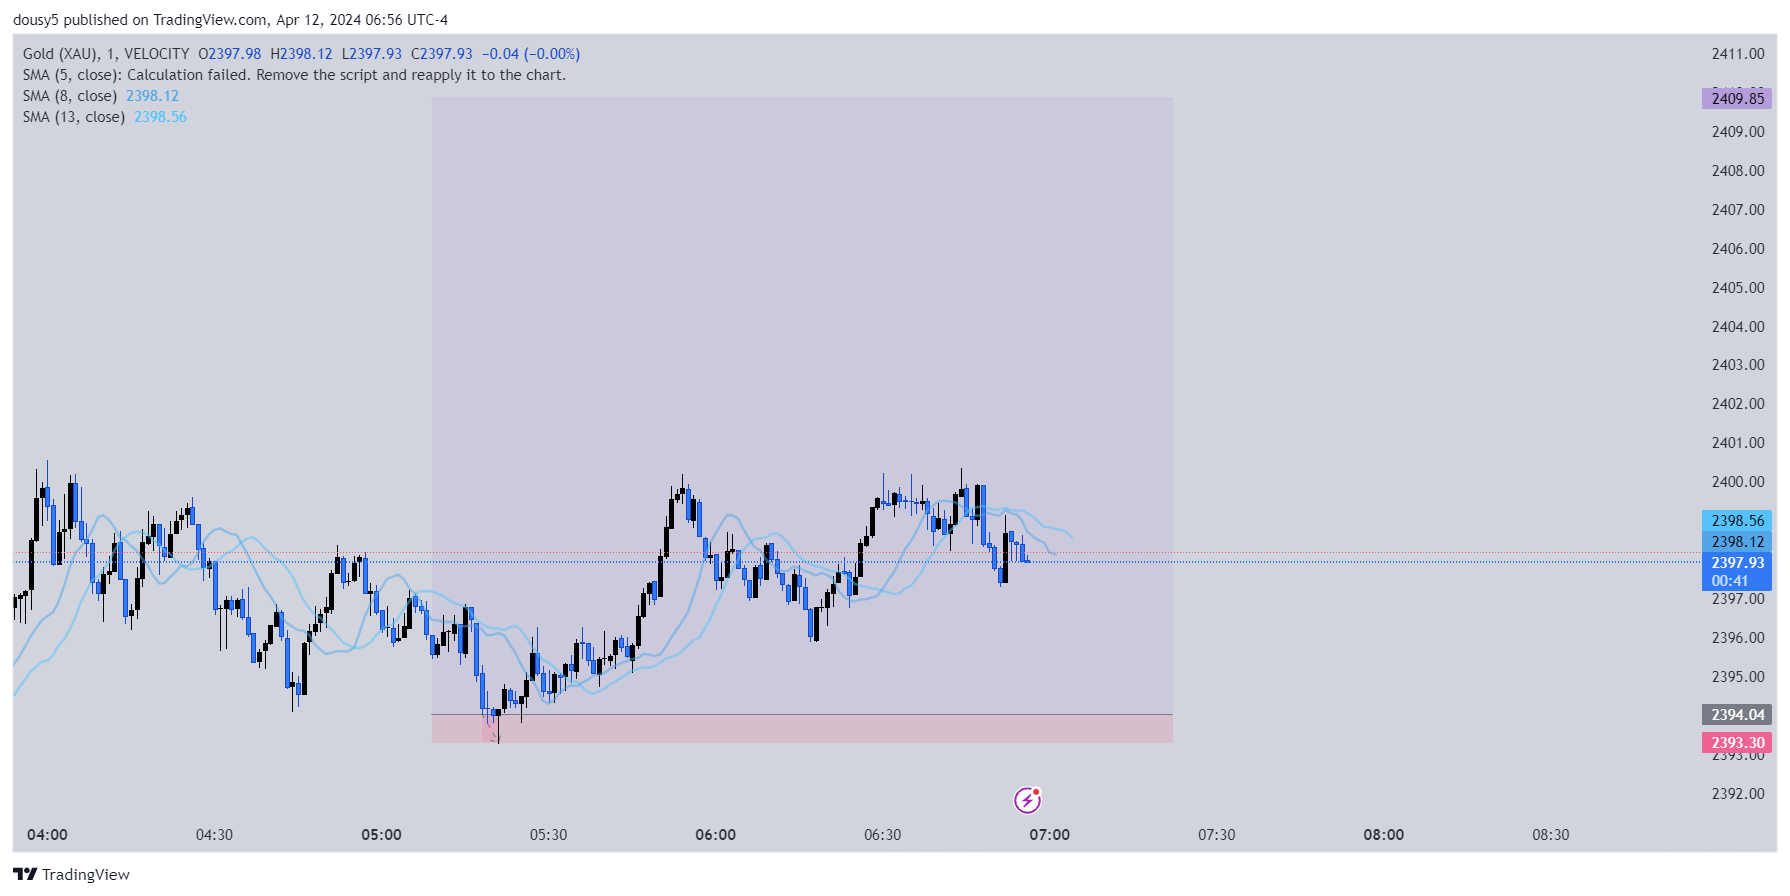
The image displays a trading chart for Gold (XAU), indicating various price levels and moving averages, along with some error messages related to the calculation of a Simple Moving Average (SMA). It seems to be part of an analysis or trading strategy discussion.
Answer
The chart shows Gold (XAU) with SMA(8) at 2398.12 and SMA(13) at 2398.56.
The chart shows the price movement of Gold (XAU) with two Simple Moving Averages (SMA) displayed: SMA(8) at 2398.12 and SMA(13) at 2398.56.
Answer for screen readers
The chart shows the price movement of Gold (XAU) with two Simple Moving Averages (SMA) displayed: SMA(8) at 2398.12 and SMA(13) at 2398.56.
More Information
The chart indicates a brief snapshot of Gold price movements, with SMAs helping to identify trends. A calculation issue with the script is noted.
AI-generated content may contain errors. Please verify critical information