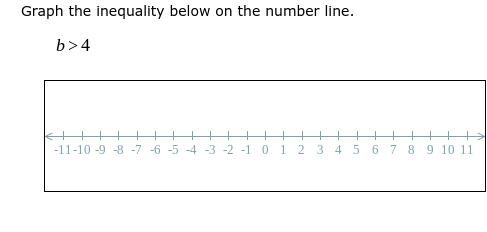
Graph the inequality below on the number line. b > 4

Understand the Problem
The question is asking us to graph the inequality b > 4 on a number line, indicating that the values of b are greater than 4.
Answer
The graph of the inequality $b > 4$ has an open circle at 4 and shaded to the right.
Answer for screen readers
The graph of the inequality $b > 4$ shows an open circle at 4 and shading to the right indicating all numbers greater than 4.
Steps to Solve
-
Identify the inequality The inequality given is $b > 4$, which means that $b$ can be any number greater than 4.
-
Determine the point on the number line Locate the number 4 on the number line. This is where the graph will start, but the value 4 itself is not included in the solution.
-
Use an open circle to show exclusivity Since $b$ can be greater than, but not equal to, 4, represent this by placing an open circle at 4 on the number line. This indicates that 4 is not part of the solution.
-
Shade the appropriate region Shade the region to the right of the open circle at 4. This shading indicates all values of $b$ that are greater than 4.
The graph of the inequality $b > 4$ shows an open circle at 4 and shading to the right indicating all numbers greater than 4.
More Information
In graphing inequalities, an open circle indicates that the boundary point is not included in the solution set. Conversely, a closed circle would indicate inclusion.
Tips
- Using a closed circle: A common mistake is to use a closed circle at 4 instead of an open circle, which would imply that 4 is included in the solution.
- Shading in the wrong direction: Some may mistakenly shade to the left instead of the right. The inequality sign ($>$) indicates shading to the right.
AI-generated content may contain errors. Please verify critical information