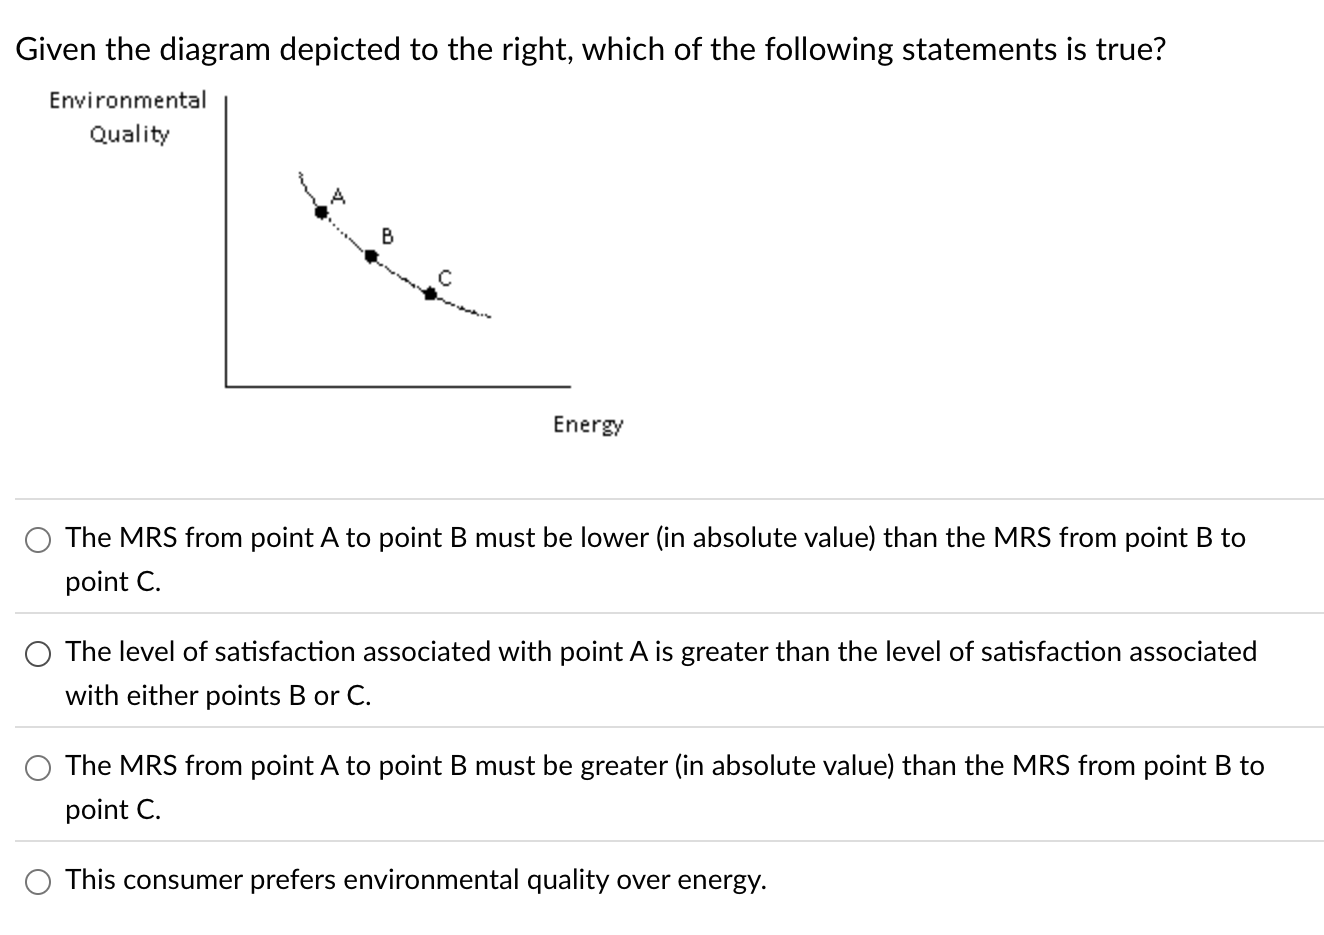
Given the diagram depicted to the right, which of the following statements is true?

Understand the Problem
The question is asking us to evaluate a diagram that illustrates the relationship between environmental quality and energy consumption, and to determine which statement regarding the marginal rate of substitution (MRS) and consumer preferences is true based on the information provided.
Answer
The MRS from A to B is greater than from B to C.
The MRS from point A to point B must be greater (in absolute value) than the MRS from point B to point C.
Answer for screen readers
The MRS from point A to point B must be greater (in absolute value) than the MRS from point B to point C.
More Information
On a convex indifference curve, as you move from left to right, the slope (MRS) typically decreases, meaning the MRS becomes lower in magnitude.
Tips
A common mistake is to misunderstand how the slope of the indifference curve changes. Remember, the curve is convex to the origin, indicating a decreasing MRS.
Sources
AI-generated content may contain errors. Please verify critical information