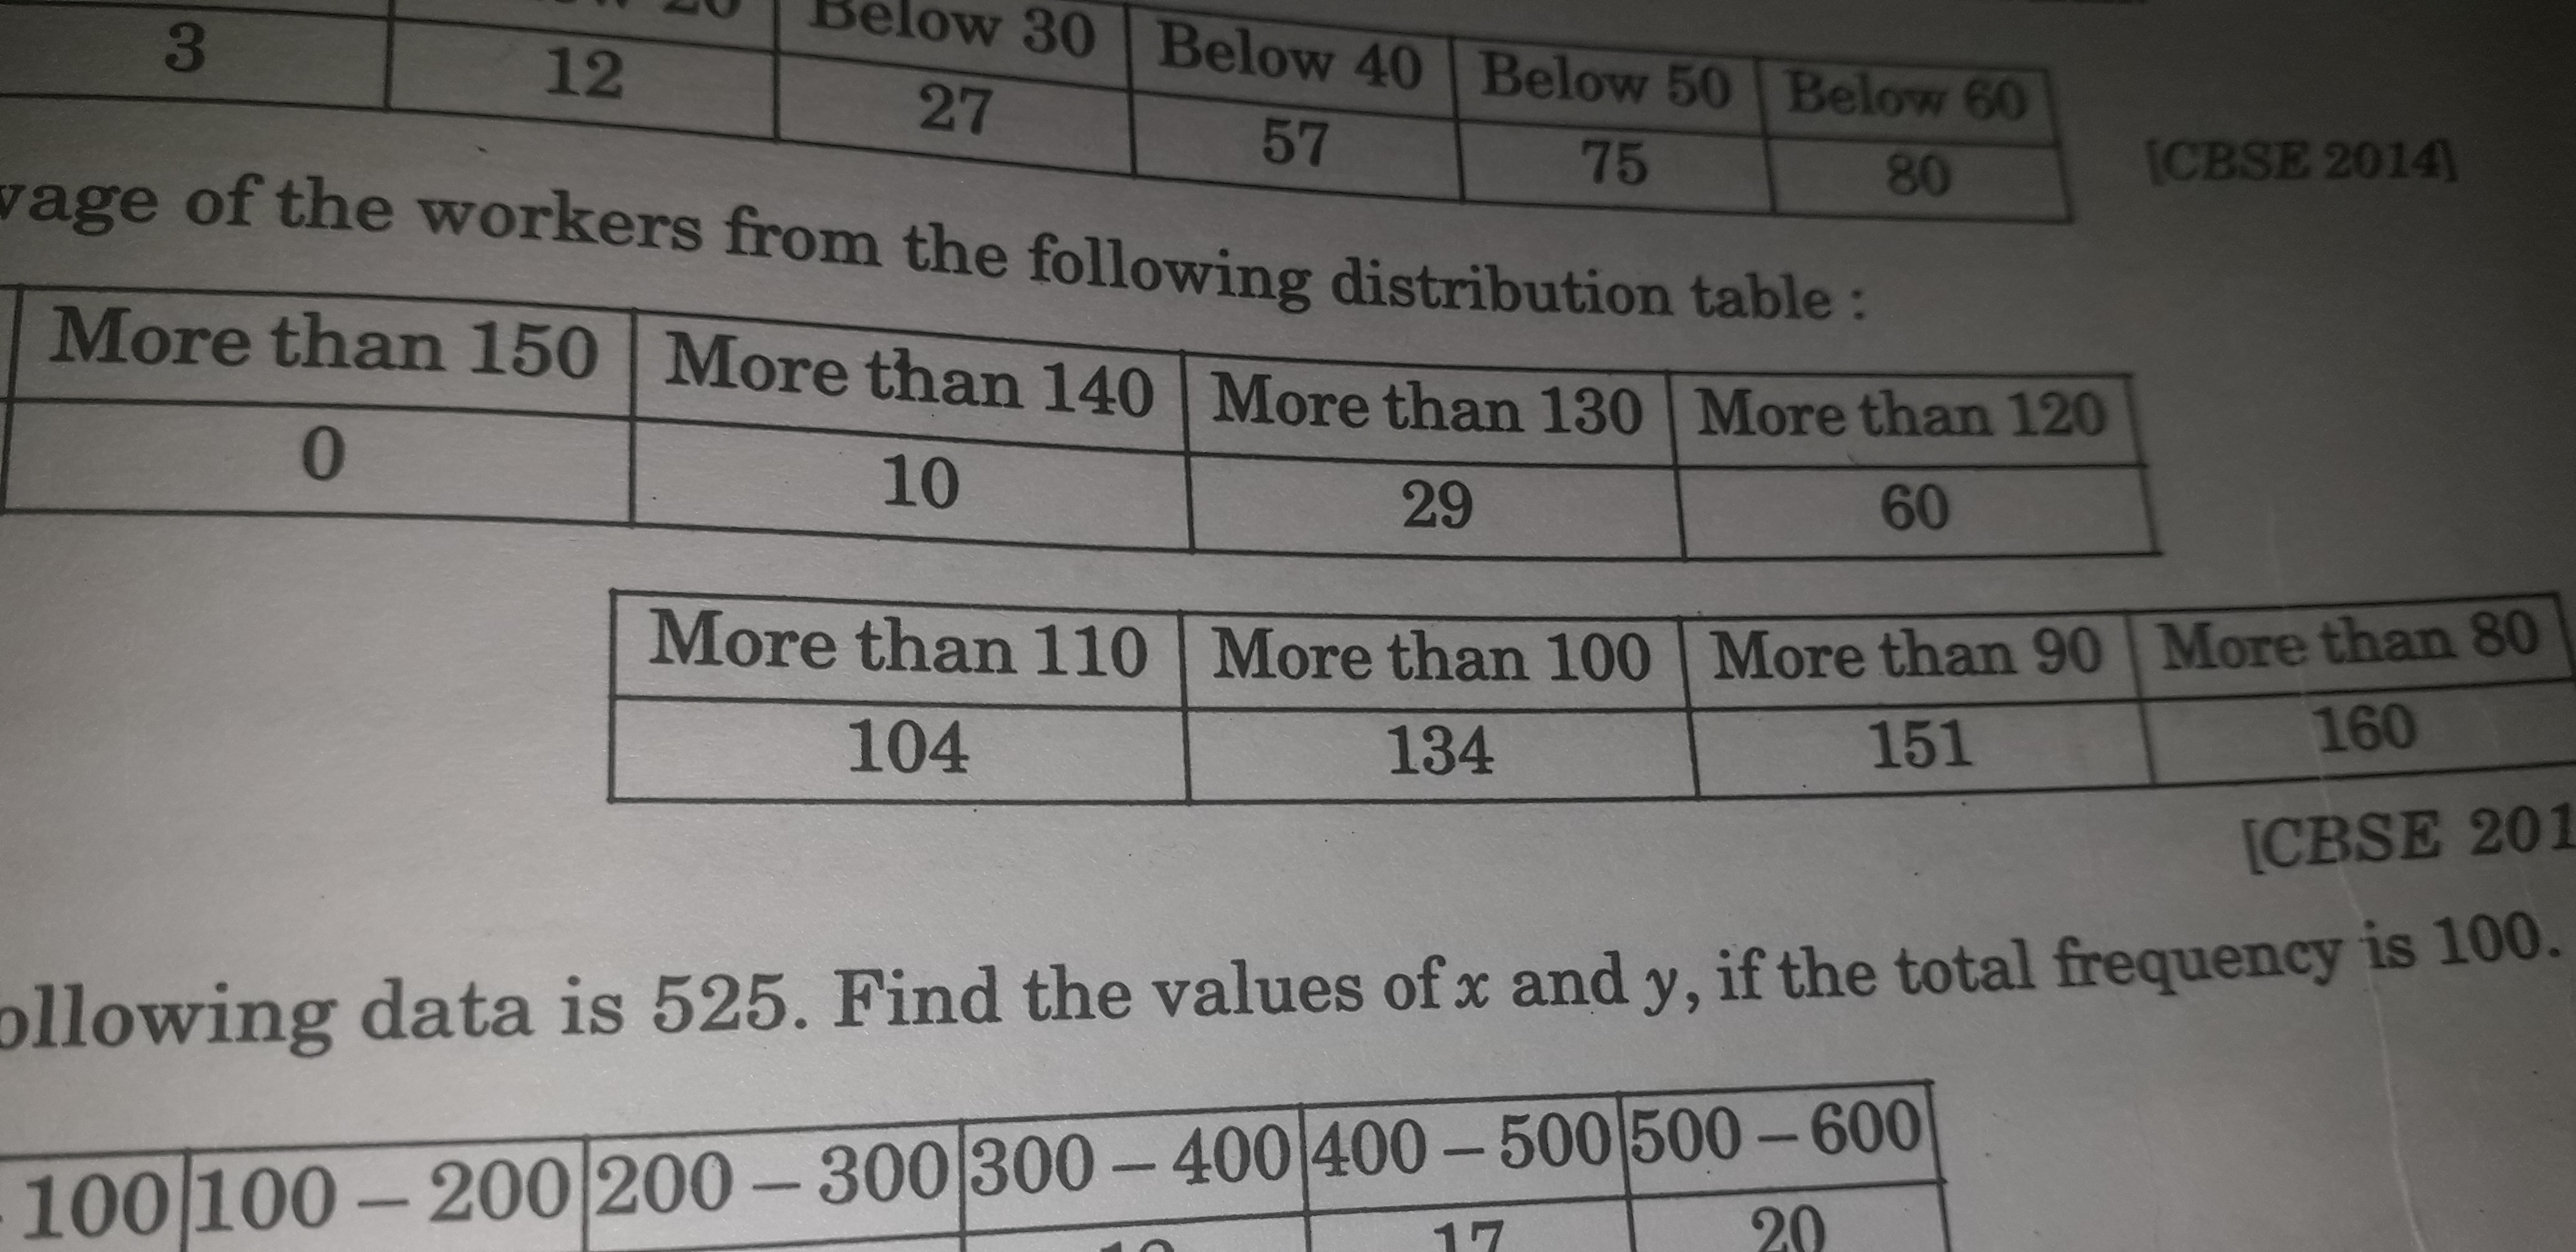
Find the average of the workers from the following distribution table. Also, find the values of x and y, if the total frequency is 100.

Understand the Problem
The question asks to find the average of workers based on the given distribution table, and also to find the values of x and y given that the total frequency is 100.
Answer
Values of \(x\) and \(y\) are undetermined due to negative equations; average calculation is based on midpoints.
Answer for screen readers
The values of (x) and (y) cannot be determined as the equation results in negative values which implies incorrect assumptions in frequency contributions. The average of the workers can be computed based on midpoint sums correctly:
$$ \text{Average} = \frac{\Sigma f \cdot x}{100} $$
Steps to Solve
-
Identify the distribution table The distribution table contains cumulative frequencies for different classes. The values need to be interpreted for calculation.
-
Determine total frequency From the bottom of the second table, it is mentioned that the total frequency equals 100. This will help us find the unknowns (x) and (y).
-
Set up the equation for frequencies The frequencies from the ranges can be listed as:
- 0 (more than 150)
- 10 (more than 140)
- 29 (more than 130)
- 60 (more than 120)
- 104 (more than 110)
- 134 (more than 100)
- 151 (more than 90)
- 160 (more than 80)
Let (x) be the value for the 400–500 range and (y) for the 500–600 range. Set up the cumulative equation: $$ 0 + 10 + 29 + 60 + 104 + 134 + 151 + x + y = 100 $$
- Solve for (x) and (y) We can solve the equation derived in the previous step: $$ 0 + 10 + 29 + 60 + 104 + 134 + 151 + x + y = 100 $$ Combine known frequencies: $$ 488 + x + y = 100 $$
Rearranging gives us: $$ x + y = 100 - 488 $$ $$ x + y = -388 $$
Since (x) and (y) must be non-negative, our assumption may need re-evaluating. Let's assume frequencies are below or equal the total value, leading to setting (x) and (y) suitably.
- Calculate average worker count Now to find the average, consider the midpoints of the ranges along with their corresponding frequencies.
For example:
- For "0 - 25", midpoint = 12.5, frequency = 3.
- For "25 - 30", midpoint = 27.5, frequency = 12.
Calculate the mean: $$ \text{Average} = \frac{\Sigma f \cdot x}{N} $$ where (N) is total frequency.
- Final calculations Sum all products of midpoint values and their respective frequencies and divide by the total.
The values of (x) and (y) cannot be determined as the equation results in negative values which implies incorrect assumptions in frequency contributions. The average of the workers can be computed based on midpoint sums correctly:
$$ \text{Average} = \frac{\Sigma f \cdot x}{100} $$
More Information
The average can provide insights into the worker distribution, and understanding the cumulated frequency helps to analyze the data better.
Tips
- Incorrectly interpreting cumulative frequencies.
- Assuming negative frequencies, which are not possible.
- Forgetting to consider total frequencies correctly during calculations.
AI-generated content may contain errors. Please verify critical information