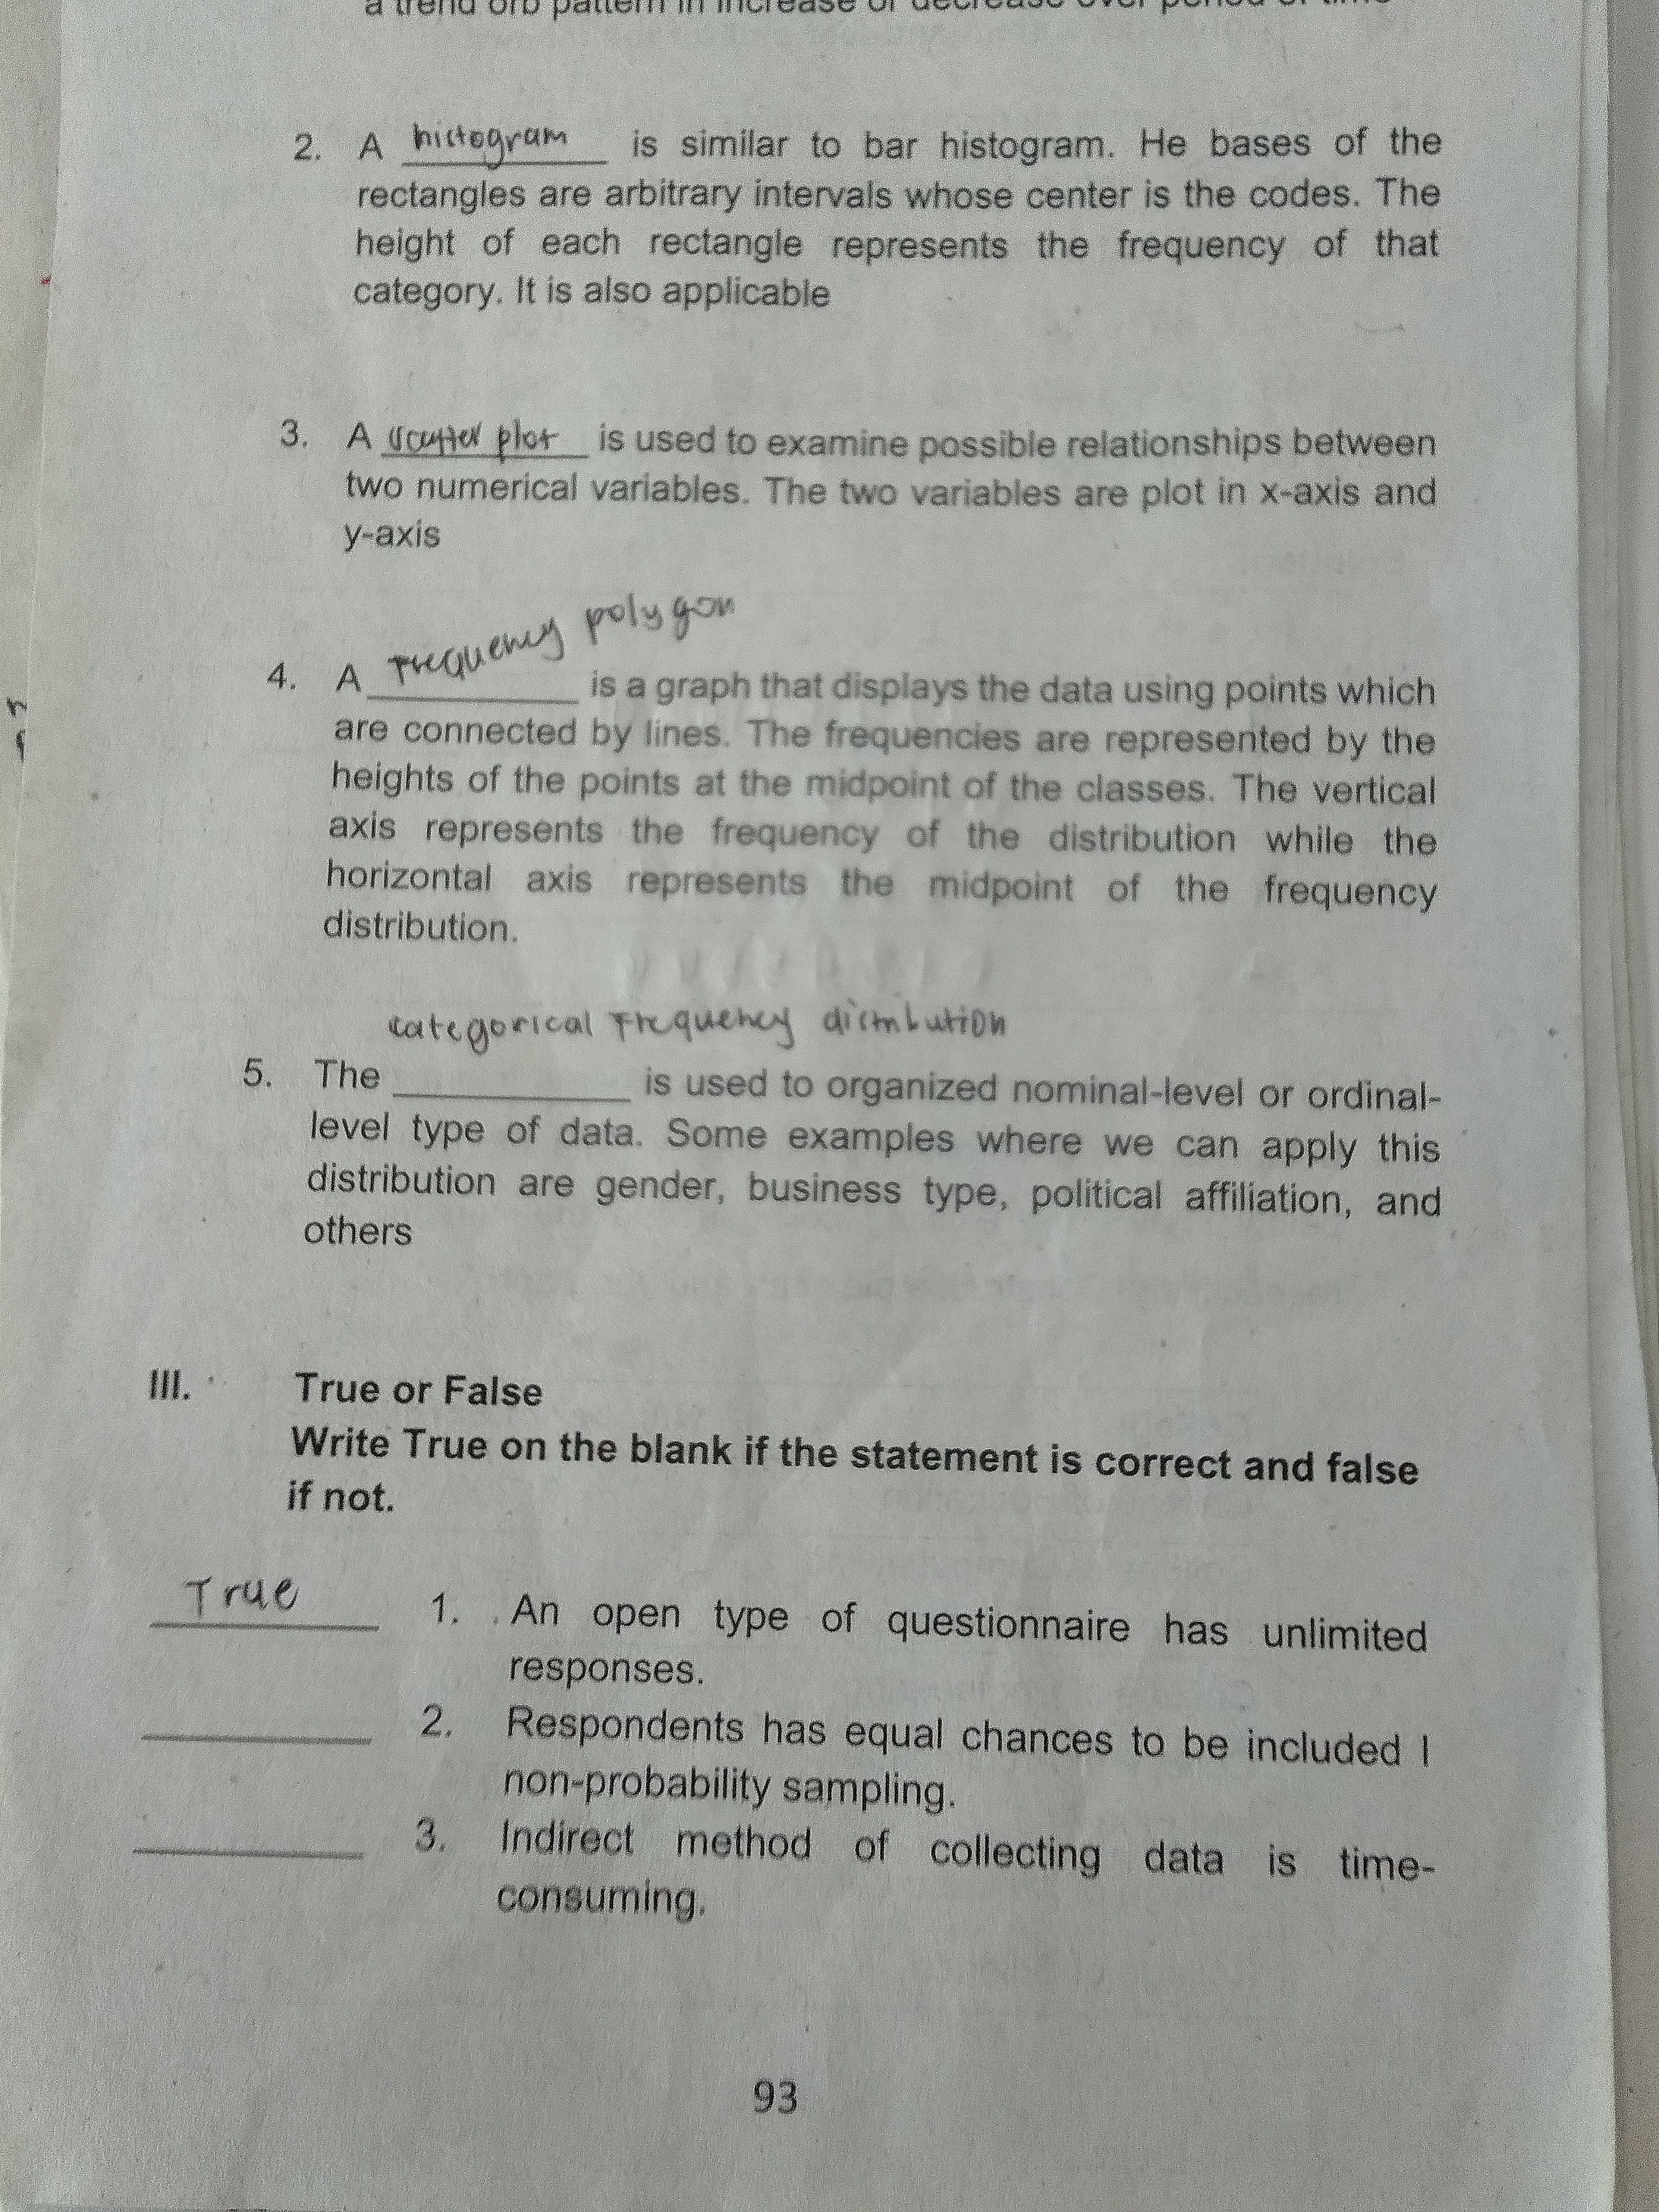
Explain the following statistical terms: histogram, scatter plot, frequency polygon, and categorical frequency distribution. Also, write True or False for the following statements... Explain the following statistical terms: histogram, scatter plot, frequency polygon, and categorical frequency distribution. Also, write True or False for the following statements regarding research methodologies.

Understand the Problem
The question is asking for an explanation of various statistical terms and a True or False evaluation of several statements regarding research methodologies. The focus is on understanding specific concepts related to data representation and collection methods.
Answer
1. True, 2. False, 3. True
The final answer is: 1. True, 2. False, 3. True.
Answer for screen readers
The final answer is: 1. True, 2. False, 3. True.
More Information
- Histogram: A bar graph showing the frequency of occurrences of different data intervals.
- Scatter Plot: A graph showing the relationship between two variables using Cartesian coordinates.
- Frequency Polygon: A line graph that connects the midpoints of a histogram's bars.
- Categorical Frequency Distribution: Classifies data into categories showing frequency counts.
Tips
For statement 2, remember that non-probability sampling does not provide equal chances for all respondents.
Sources
- Frequency distribution - Australian Bureau of Statistics - abs.gov.au
- Histograms, Frequency Polygons, and Time Series Graphs - Lumen - courses.lumenlearning.com
AI-generated content may contain errors. Please verify critical information