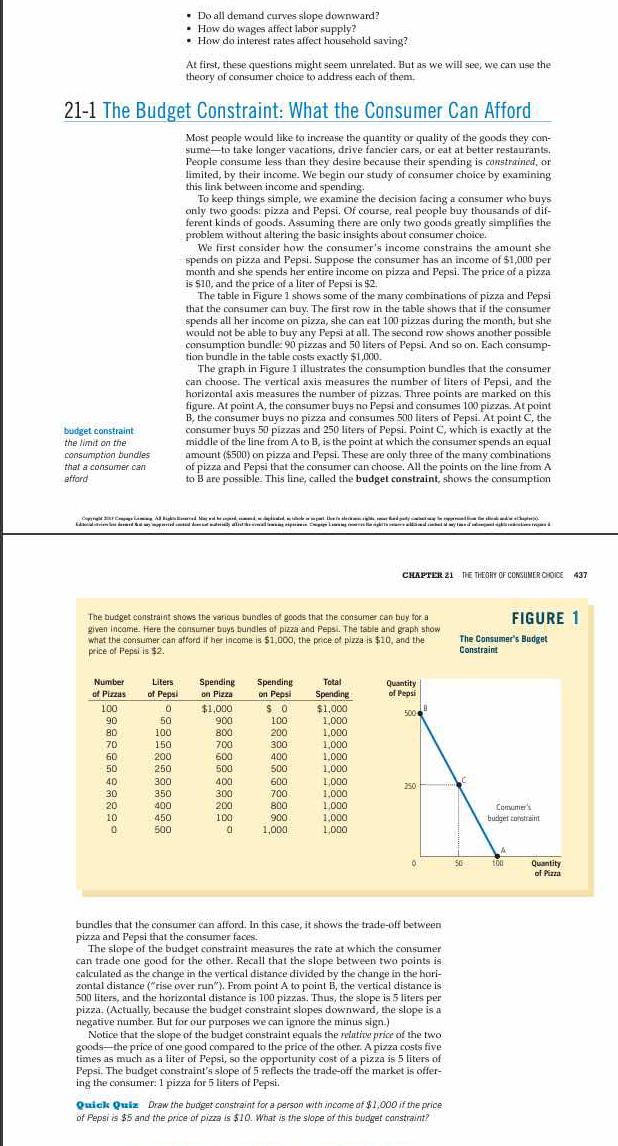
Draw the budget constraint for a person with income of $1,000 if the price of Pepsi is $5 and the price of pizza is $10. What is the slope of this budget constraint?

Understand the Problem
The question involves understanding the concept of a budget constraint in consumer choice, specifically regarding how varying prices affect what a consumer can afford. The user is being asked to draw the budget constraint given specific income and price conditions.
Answer
The budget constraint equation is $Q_{pe} = 500 - 5Q_p$ with a slope of -5.
Answer for screen readers
The budget constraint equation is given by:
$$ Q_{pe} = 500 - 5Q_p $$
The slope of the budget constraint is -5.
Steps to Solve
-
Identify the Given Values
The consumer's income is $I = 1000$ dollars. The price per pizza is $P_p = 10$ dollars, and the price per liter of Pepsi is $P_pe = 2$ dollars.
-
Determine Maximum Quantities
Calculate the maximum amount of pizza that can be bought if all income is spent on pizza:
$$ Q_p^{max} = \frac{I}{P_p} = \frac{1000}{10} = 100 $$
Calculate the maximum amount of Pepsi that can be bought if all income is spent on Pepsi:
$$ Q_{pe}^{max} = \frac{I}{P_{pe}} = \frac{1000}{2} = 500 $$
-
Calculate the Budget Constraint Equation
The budget constraint can be expressed as:
$$ I = P_p \times Q_p + P_{pe} \times Q_{pe} $$
Rearranging for $Q_{pe}$ gives:
$$ Q_{pe} = \frac{I}{P_{pe}} - \frac{P_p}{P_{pe}} \times Q_p $$
Substituting the values:
$$ Q_{pe} = 500 - 5Q_p $$
-
Plotting the Budget Constraint
To plot the constraint, identify two key points:
- When $Q_p = 0$, $Q_{pe} = 500$.
- When $Q_{pe} = 0$, $Q_p = 100$.
These points allow you to draw a straight line on a graph representing the trade-off between pizzas and Pepsi.
-
Determine the Slope of the Budget Constraint
The slope is calculated by the negative ratio of the prices:
$$ \text{slope} = -\frac{P_p}{P_{pe}} = -\frac{10}{2} = -5 $$
The budget constraint equation is given by:
$$ Q_{pe} = 500 - 5Q_p $$
The slope of the budget constraint is -5.
More Information
The budget constraint visually represents how much of each good a consumer can afford with their income. The slope indicates the trade-off rate between the two goods, meaning for every additional pizza purchased, 5 liters of Pepsi must be forgone.
Tips
- Failing to calculate maximum quantities correctly.
- Incorrectly rearranging the budget constraint equation.
- Forgetting to interpret the slope of the budget constraint properly in terms of the trade-off between goods.
AI-generated content may contain errors. Please verify critical information