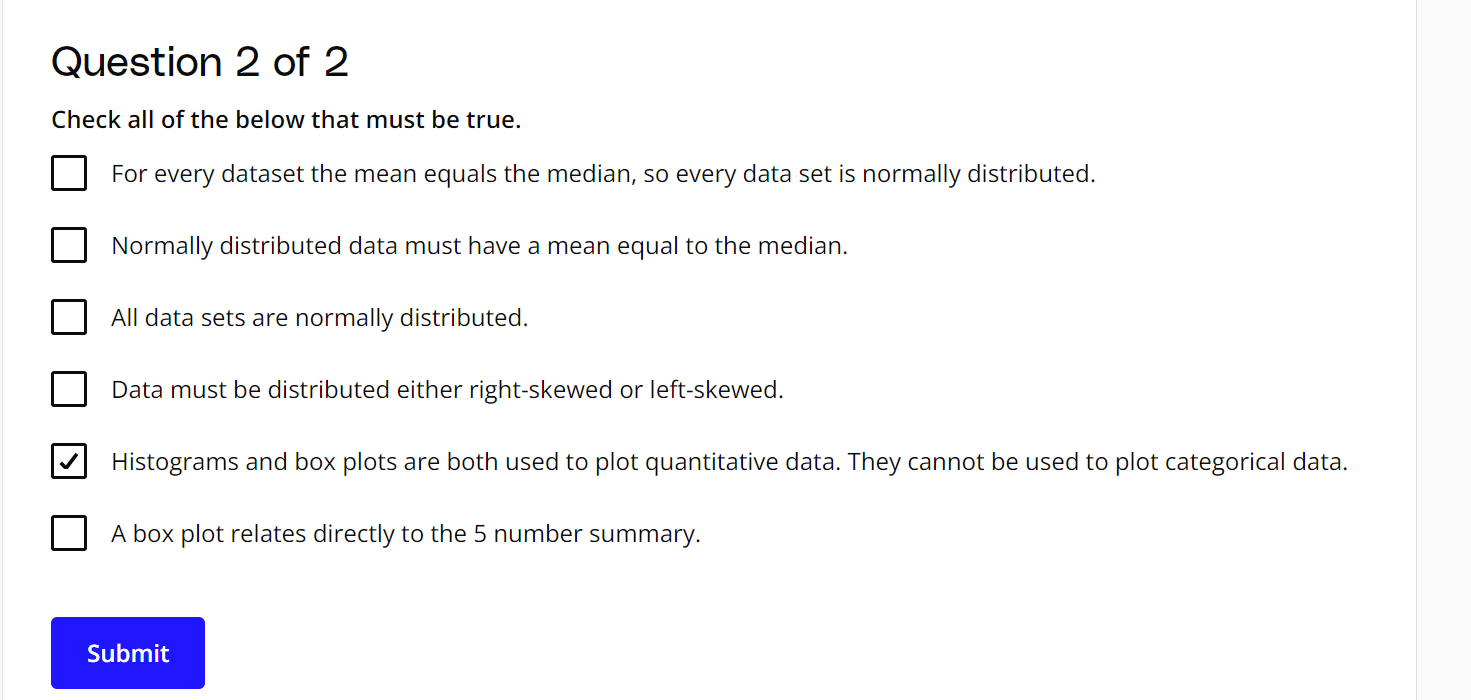
Check all of the below that must be true: 1. For every dataset the mean equals the median, so every data set is normally distributed. 2. Normally distributed data must have a mean... Check all of the below that must be true: 1. For every dataset the mean equals the median, so every data set is normally distributed. 2. Normally distributed data must have a mean equal to the median. 3. All data sets are normally distributed. 4. Data must be distributed either right-skewed or left-skewed. 5. Histograms and box plots are both used to plot quantitative data. They cannot be used to plot categorical data. 6. A box plot relates directly to the 5 number summary.

Understand the Problem
The question is asking to identify which statements about data distributions and graphical representations of data are true. It involves understanding statistical concepts related to data distribution, such as the mean, median, and the types of plots used for different types of data.
Answer
2, 5, 6
Normally distributed data must have a mean equal to the median. Histograms and box plots are both used to plot quantitative data. They cannot be used to plot categorical data. A box plot relates directly to the 5 number summary.
Answer for screen readers
Normally distributed data must have a mean equal to the median. Histograms and box plots are both used to plot quantitative data. They cannot be used to plot categorical data. A box plot relates directly to the 5 number summary.
More Information
In a normal distribution, the mean, median, and mode are equal. Histograms and box plots are tools used to visualize quantitative data. A box plot is directly related to the five-number summary, which includes the minimum, first quartile, median, third quartile, and maximum.
Tips
Common mistakes include assuming all data sets are normally distributed or that mean and median equality implies normal distribution.
Sources
- Does a 'Normal Distribution' need to have mean=median=mode? - stats.stackexchange.com
- Skewness and the Mean, Median, and Mode | Introduction to Statistics - courses.lumenlearning.com
- Empirical Rule: Definition, Formula, Example, How It's Used - investopedia.com