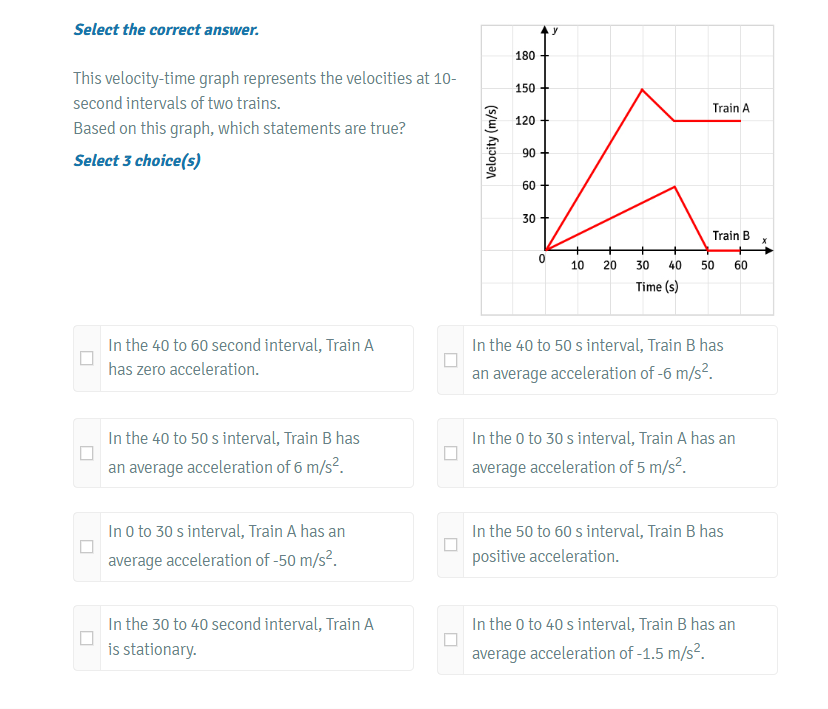
Based on this graph, which statements are true regarding the acceleration of the trains during the specified time intervals?

Understand the Problem
The question is asking to analyze a velocity-time graph for two trains and determine which statements regarding their accelerations during specified time intervals are true.
Answer
Train A zero acceleration (40-60s), Train B 6 m/s² (40-50s), Train A 5 m/s² (0-30s).
The correct statements are:
- In the 40 to 60 second interval, Train A has zero acceleration.
- In the 40 to 50 s interval, Train B has an average acceleration of 6 m/s².
- In the 0 to 30 s interval, Train A has an average acceleration of 5 m/s².
Answer for screen readers
The correct statements are:
- In the 40 to 60 second interval, Train A has zero acceleration.
- In the 40 to 50 s interval, Train B has an average acceleration of 6 m/s².
- In the 0 to 30 s interval, Train A has an average acceleration of 5 m/s².
More Information
Train A maintains constant velocity between 40-60s, indicating zero acceleration. Train B increases velocity from 40 to 50s, and calculations show an acceleration of 6 m/s². Train A's acceleration from 0 to 30s can be calculated as positive 5 m/s².
Tips
A common mistake is not checking the slope of the graph for each interval, leading to incorrect acceleration assumptions.
AI-generated content may contain errors. Please verify critical information