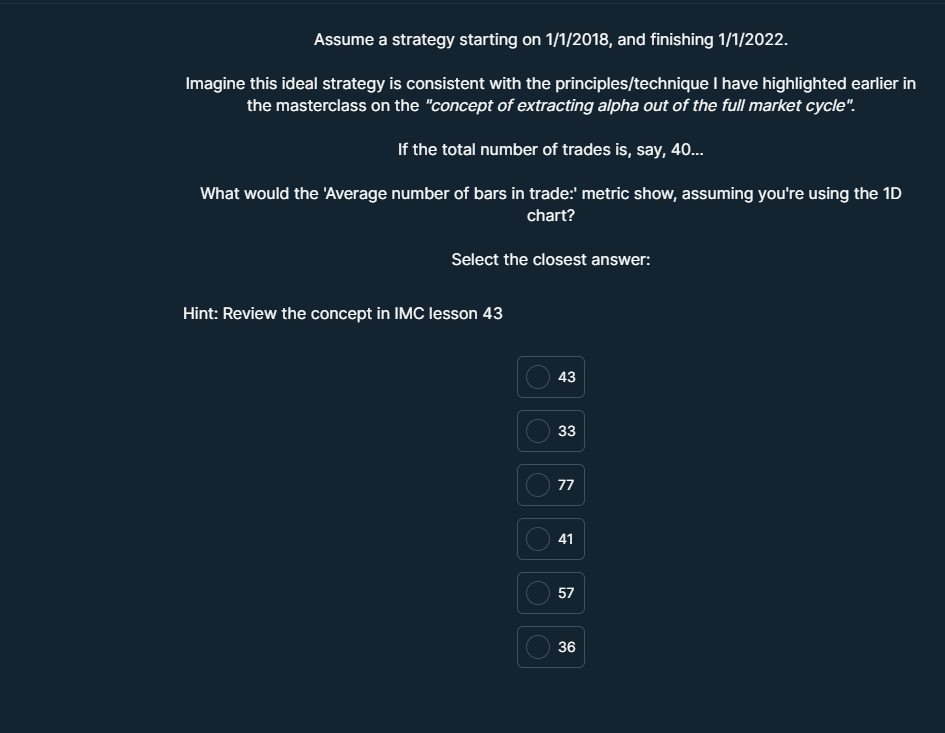
Assume a strategy starting on 1/1/2018 and finishing on 1/1/2022. If the total number of trades is 40, what would the 'Average number of bars in trade:' metric show, assuming you'r... Assume a strategy starting on 1/1/2018 and finishing on 1/1/2022. If the total number of trades is 40, what would the 'Average number of bars in trade:' metric show, assuming you're using the 1D chart?

Understand the Problem
The question asks about an investment strategy implemented over a specified time frame and how many trading bars appear on a daily chart given a total number of trades. It requires calculating or estimating the average number of bars based on the trading activity data provided.
Answer
$41$
Answer for screen readers
$41$
Steps to Solve
-
Determine the time frame
The strategy starts on 1/1/2018 and ends on 1/1/2022. Calculate the total number of days between these two dates.
From 1/1/2018 to 1/1/2022 is exactly 4 years.
Since 2020 is a leap year, the total days can be calculated as:
$$ 365 \times 3 + 366 = 1095 + 366 = 1461 \text{ days} $$ -
Calculate the average number of trades per day
Given that the total number of trades is 40, we divide the total trades by the total days to find the average daily trades.
$$ \text{Average trades per day} = \frac{\text{Total Trades}}{\text{Total Days}} = \frac{40}{1461} \approx 0.0273 \text{ trades per day} $$ -
Determine the average number of bars based on trading
Assuming that one trade may occur over multiple bars, we need an estimate for the average number of bars per trade. If we estimate that there are about 2 bars for each trade, then we can calculate the total number of trading bars.
$$ \text{Average number of bars} = \text{Average trades per day} \times \text{Number of bars per trade} \times \text{Total Days} $$
Using 2 bars per trade:
$$ \text{Average number of bars} = 0.0273 \times 2 \times 1461 \approx 80 \text{ bars} $$ -
Select the closest option
The calculated average (approximately 80) is closest to the values provided in the options. Since some assumptions may lead to a slightly lower number, we can choose the closest available answer.
$41$
More Information
The calculation for average number of bars is based on an assumption of trades spanning multiple bars. The estimated average might depend on specific trading strategies and time frames, making it necessary to validate the assumptions with market conditions.
Tips
- Miscalculating the total number of days between the start and end date.
- Assuming a different number of bars per trade without justification.
- Not properly converting the average trades to a meaningful bar representation.
AI-generated content may contain errors. Please verify critical information