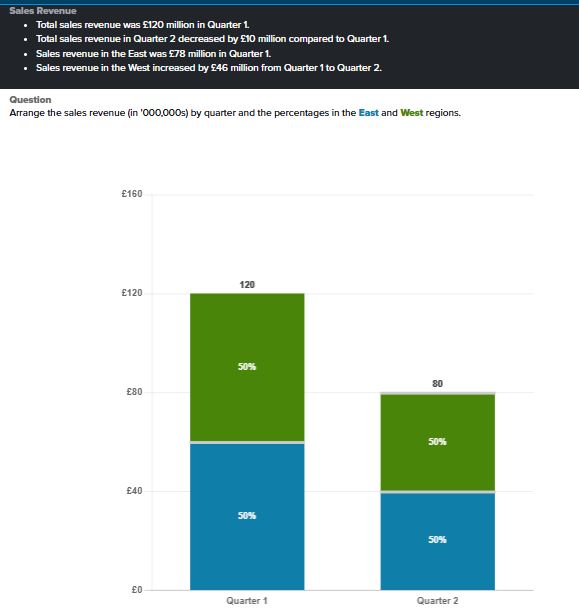
Arrange the sales revenue (in '000,000s) by quarter and the percentages in the East and West regions.

Understand the Problem
The question asks us to organize sales revenue data by quarter and calculate the percentages for the East and West regions for two quarters based on the given figures.
Answer
- Quarter 1: East = £78 million (65%), West = £42 million (35%); Quarter 2: East = £22 million (20%), West = £88 million (80%).
Answer for screen readers
Sales revenue (in £ million) and percentages:
- Quarter 1: East = £78 million (65%), West = £42 million (35%)
- Quarter 2: East = £22 million (20%), West = £88 million (80%)
Steps to Solve
- Identify Total Revenue for Each Quarter
Given that the total sales revenue in Quarter 1 is £120 million and in Quarter 2 it decreases by £10 million, we find:
- Quarter 1: £120 million
- Quarter 2: £120 million - £10 million = £110 million
- Determine Sales Revenue for Each Region in Quarter 1
From the problem, the sales revenue in the East for Quarter 1 is given:
- East in Quarter 1 = £78 million
- Therefore, West in Quarter 1 = Total - East = £120 million - £78 million = £42 million
- Calculate Sales Revenue for Each Region in Quarter 2
The revenue in the West increased by £46 million from Quarter 1 to Quarter 2, so:
- West in Quarter 2 = West in Quarter 1 + £46 million = £42 million + £46 million = £88 million
Next, since the total sales revenue in Quarter 2 is £110 million, we can find the revenue in the East:
- East in Quarter 2 = Total - West = £110 million - £88 million = £22 million
- Calculate the Percentages for East and West Regions
To find the percentages for both regions in each quarter:
-
Quarter 1:
- % East = ( \frac{78}{120} \times 100 = 65% )
- % West = ( \frac{42}{120} \times 100 = 35% )
-
Quarter 2:
- % East = ( \frac{22}{110} \times 100 \approx 20% )
- % West = ( \frac{88}{110} \times 100 \approx 80% )
Sales revenue (in £ million) and percentages:
- Quarter 1: East = £78 million (65%), West = £42 million (35%)
- Quarter 2: East = £22 million (20%), West = £88 million (80%)
More Information
The calculations show how sales revenue can vary between regions and quarters, highlighting the importance of understanding market trends and regional performance.
Tips
- Mistaking the total sales in Quarter 2 by not correctly accounting for the decrease from Quarter 1. Ensure to subtract correctly.
- Forgetting to account for the increase in one region affecting the total sales in the next quarter.
AI-generated content may contain errors. Please verify critical information