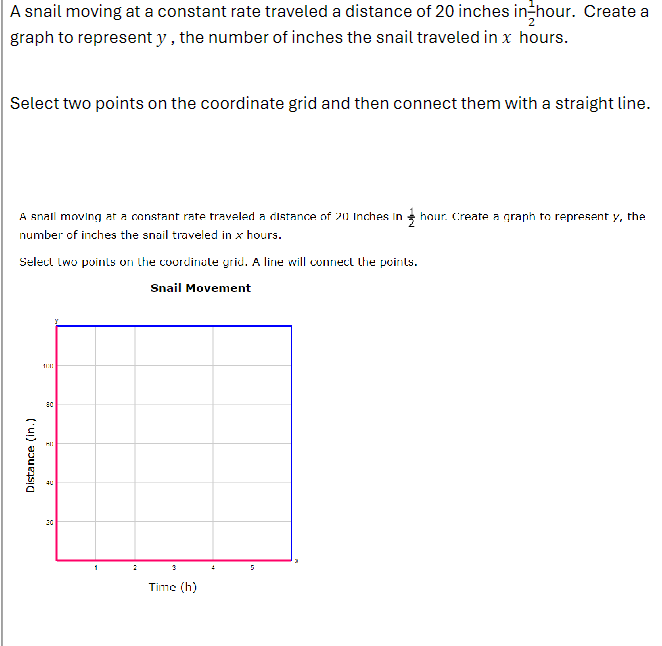
A snail moving at a constant rate traveled a distance of 20 inches in 1/2 hour. Create a graph to represent y, the number of inches the snail traveled in x hours. Select two points... A snail moving at a constant rate traveled a distance of 20 inches in 1/2 hour. Create a graph to represent y, the number of inches the snail traveled in x hours. Select two points on the coordinate grid and then connect them with a straight line.

Understand the Problem
The question is asking to create a graph that represents the distance a snail travels over time, specifically how far it moves as a function of hours. The snail travels 20 inches in 0.5 hours, which implies a constant speed. We need to determine how to express this relationship graphically by selecting two points on the grid provided.
Answer
The points to select are (1, 40) and (2, 80); the equation is $y = 40x$.
Answer for screen readers
The two points to select are (1, 40) and (2, 80). The equation that represents the relationship is $y = 40x$.
Steps to Solve
-
Determine the Speed of the Snail
The snail travels 20 inches in 0.5 hours. To find the speed in inches per hour, use the formula:
$$ \text{Speed} = \frac{\text{Distance}}{\text{Time}} = \frac{20 \text{ inches}}{0.5 \text{ hours}} = 40 \text{ inches/hour} $$ -
Identify the Relationship Between Distance and Time
With a constant speed, the relationship between distance ($y$) and time ($x$) can be expressed as:
$$ y = 40x $$
This indicates that for every hour, the snail travels 40 inches. -
Select Two Points for the Graph
Choose two values of $x$ (time in hours), for example:
- When $x = 1$ hour:
$$ y = 40 \times 1 = 40 \text{ inches} $$ - When $x = 2$ hours:
$$ y = 40 \times 2 = 80 \text{ inches} $$
Thus, the points are (1, 40) and (2, 80).
-
Plot the Points on the Coordinate Grid
Mark the points (1, 40) and (2, 80) on the grid. The first point will be at 1 on the X-axis and 40 on the Y-axis, while the second point will be at 2 on the X-axis and 80 on the Y-axis. -
Draw the Line Connecting the Points
Finally, connect the two plotted points with a straight line. This line represents the distance traveled by the snail over time.
The two points to select are (1, 40) and (2, 80). The equation that represents the relationship is $y = 40x$.
More Information
This graph visually represents the snail's movement, illustrating how distance increases linearly with time at a constant speed of 40 inches per hour.
Tips
- Incorrect Calculation of Speed: Sometimes, students may calculate speed incorrectly by not converting time consistently. Always ensure time is in the same units when calculating speed.
- Choosing Inappropriate Points: Selecting points that are too far apart can result in incorrect slopes. Ensure the points are within the limits of the graph provided.
AI-generated content may contain errors. Please verify critical information