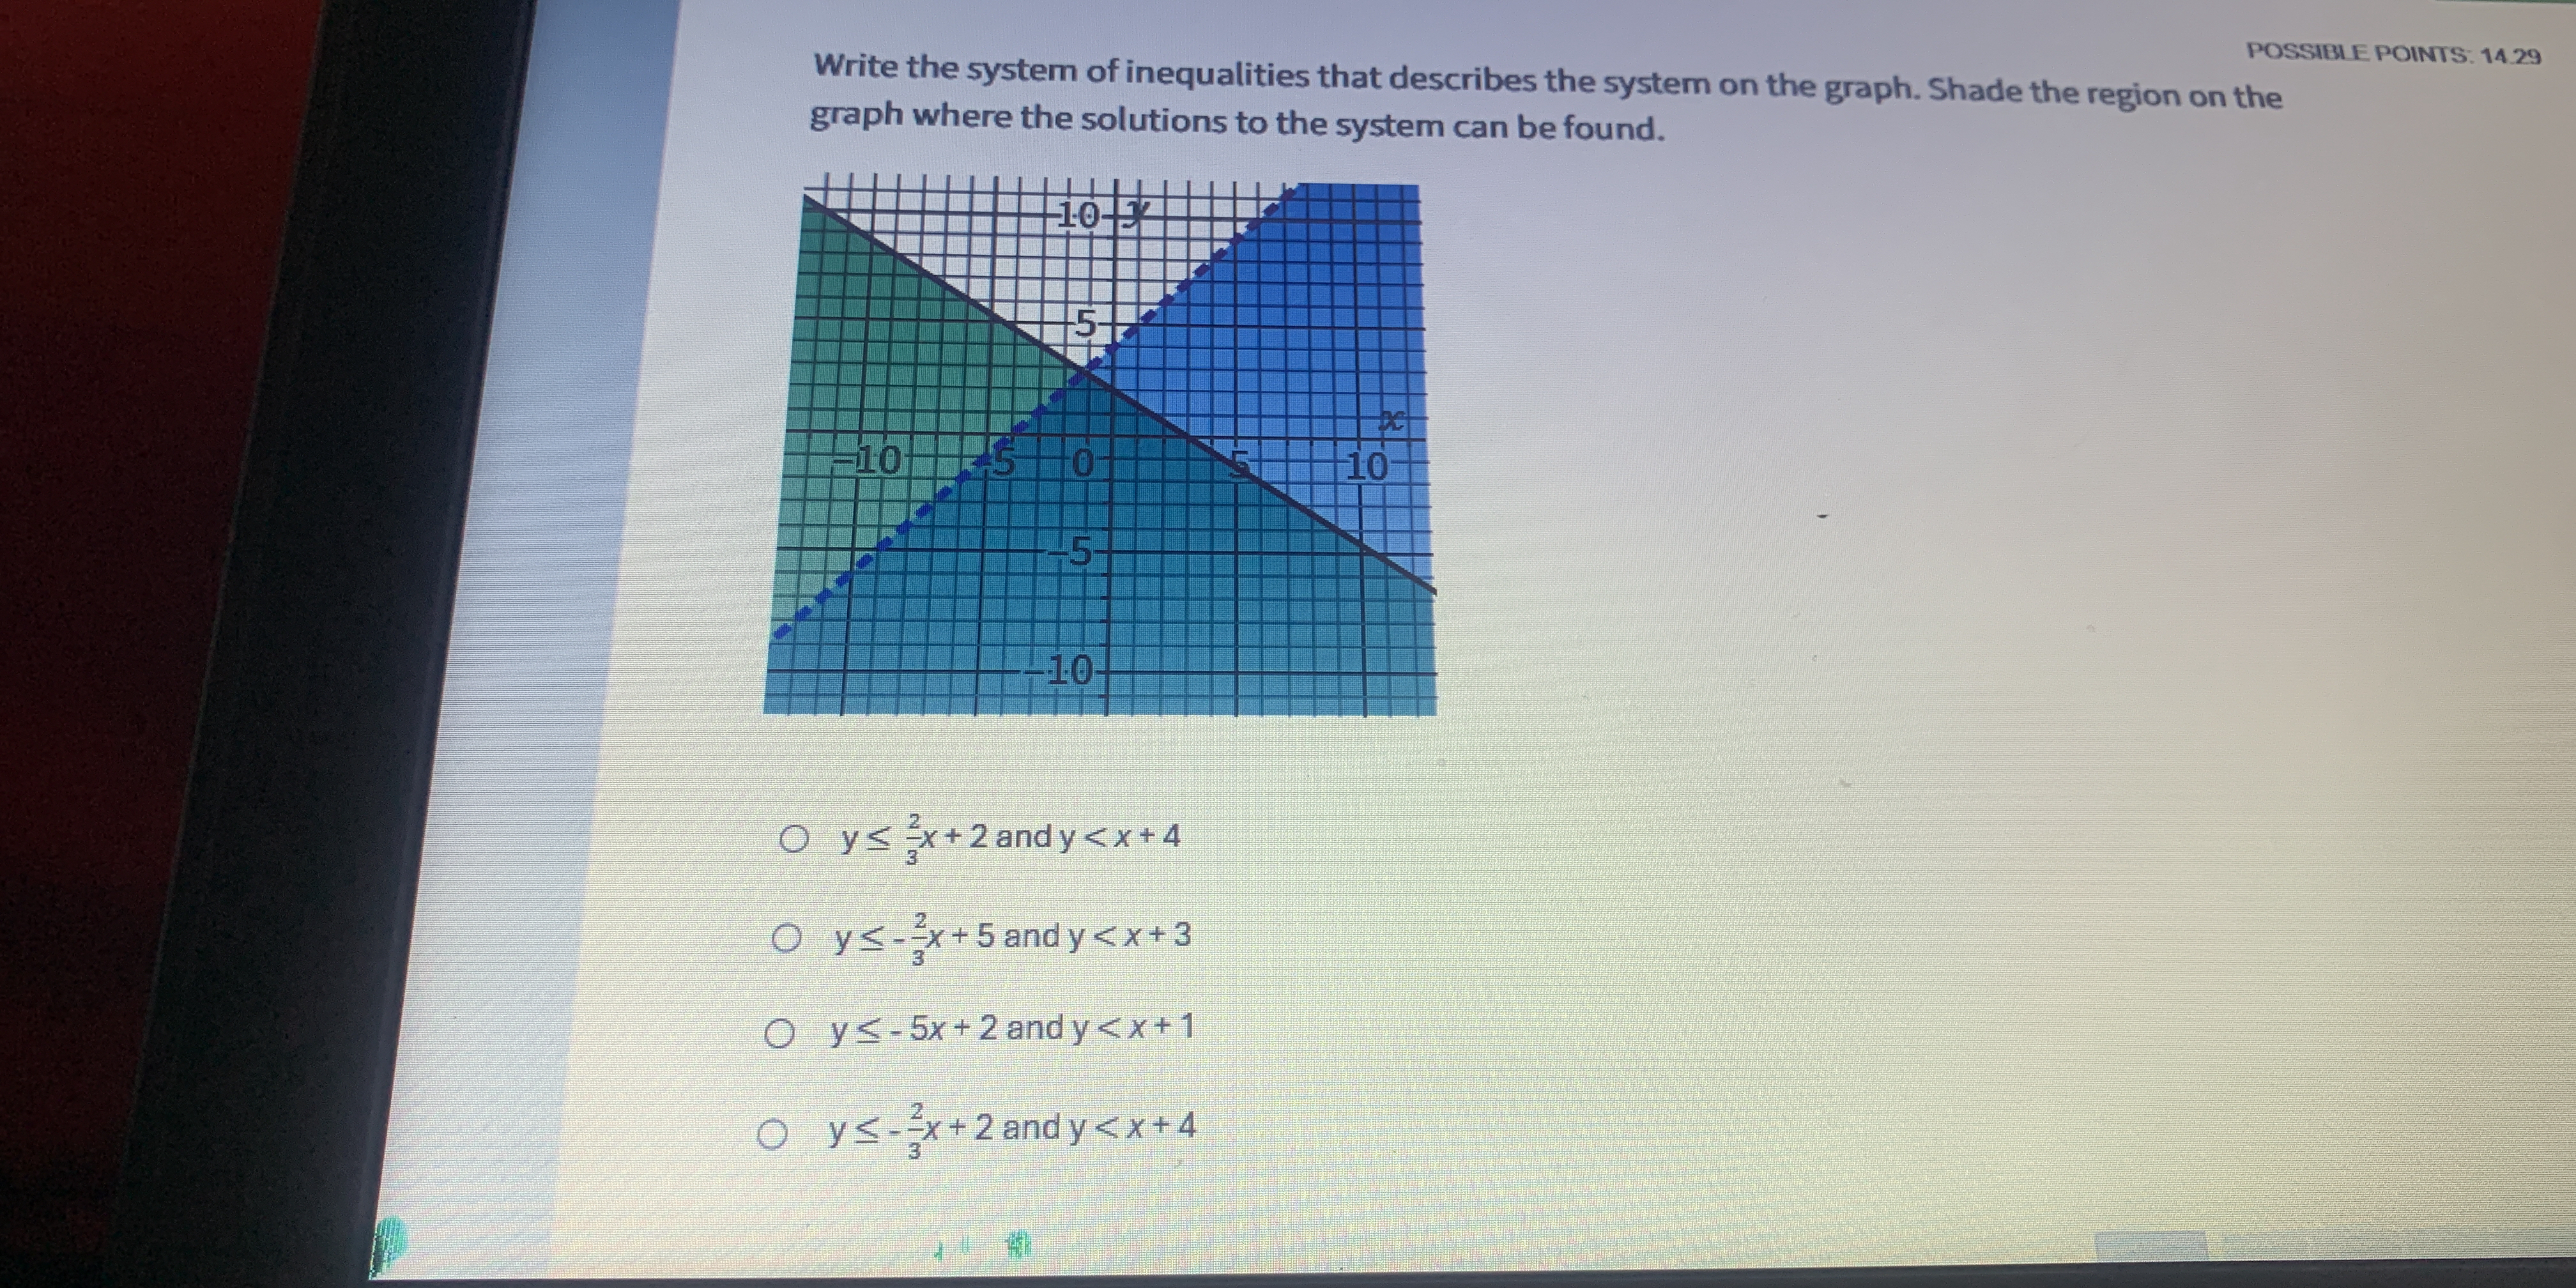
Write the system of inequalities that describes the system on the graph. Shade the region on the graph where the solutions to the system can be found.

Understand the Problem
The question is asking to write down the system of inequalities that corresponds to the shaded region in the provided graph. It requires understanding how to interpret the graph in terms of inequalities, specifically for the variables x and y.
Answer
The system of inequalities describing the shaded region includes: \( y \leq -\frac{2}{3}x + 2 \), \( y \leq -\frac{1}{5}x + 5 \), \( x \leq 4 \).
Answer for screen readers
The system of inequalities is:
- ( y \leq -\frac{2}{3}x + 2 )
- ( y \leq -\frac{1}{5}x + 5 )
- ( x \leq 4 )
Steps to Solve
- Identify the boundaries of the shaded region
Examine the lines that form the edges of the shaded areas. The borders will be key to forming the inequalities.
- Determine the equations of the lines
By observing the graph, we find the lines are:
-
The line through the points at $(0, 2)$ and $(3, 0)$, which can be expressed as: $$ y \leq -\frac{2}{3}x + 2 $$
-
The line that goes through points $(0, 5)$ and $(5, 0)$, expressed as: $$ y \leq -\frac{1}{5}x + 5 $$
- Establish vertical boundary
Next, identify any vertical boundaries. In the graph, there is a vertical line at $x=4$. Therefore, we have: $$ x \leq 4 $$
- Combine inequalities
Combine all identified inequalities to form the overall system: $$ y \leq -\frac{2}{3}x + 2 $$
$$ y \leq -\frac{1}{5}x + 5 $$
$$ x \leq 4 $$
- Verify the constraints in the given options
We need to match the established inequalities with the provided options in the question.
The system of inequalities is:
- ( y \leq -\frac{2}{3}x + 2 )
- ( y \leq -\frac{1}{5}x + 5 )
- ( x \leq 4 )
More Information
The inequalities describe linear boundaries in a two-dimensional space. The shaded region represents all the points that satisfy these inequalities, which can be visualized as intersections of these lines on a coordinate plane.
Tips
- Failing to consider the direction of the inequality when graphing the lines.
- Not checking the correct orientation of the lines with respect to the shaded area.
- Overlooking vertical lines which set limits on the $x$ variable.
AI-generated content may contain errors. Please verify critical information