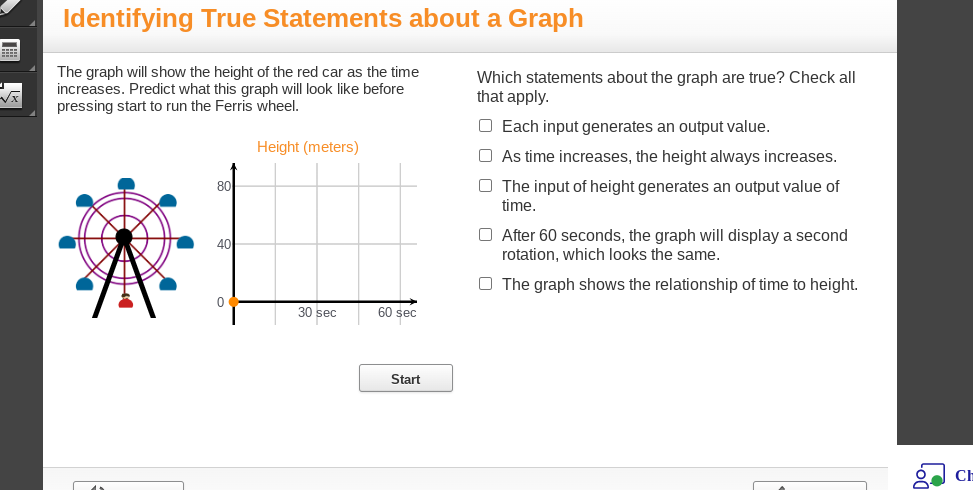
Which statements about the graph are true? Check all that apply.

Understand the Problem
The question is asking for an evaluation of certain statements regarding a graph that depicts the height of a Ferris wheel car as time increases. The user needs to determine which statements about the graph are true based on the provided information.
Answer
The graph displays these true statements: each input generates an output value, repeats every 60 seconds, and shows time-height relationship.
The true statements are: Each input generates an output value; After 60 seconds, the graph will display a second rotation, which looks the same; The graph shows the relationship of time to height.
Answer for screen readers
The true statements are: Each input generates an output value; After 60 seconds, the graph will display a second rotation, which looks the same; The graph shows the relationship of time to height.
More Information
A Ferris wheel's height relative to time will rise and fall cyclically, and restart after one complete rotation.
Tips
Common mistakes include assuming the height always increases or misunderstanding the cyclical nature of the graph.