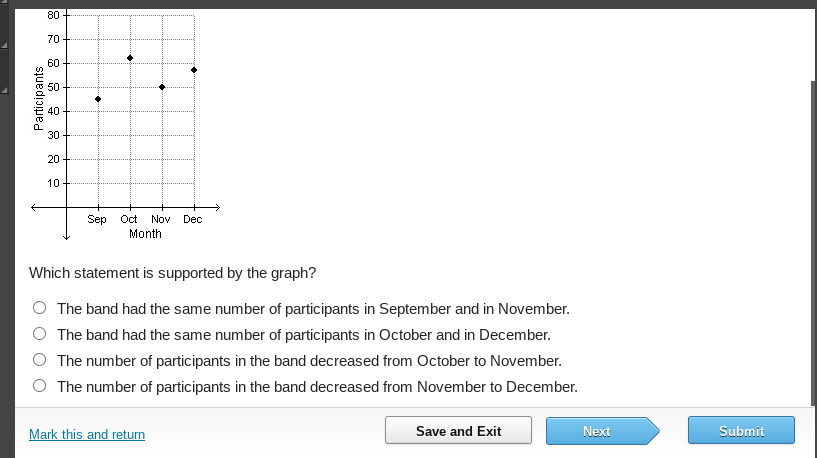
Which statement is supported by the graph?

Understand the Problem
The question is asking for an interpretation of the graph provided. It requires analyzing data regarding the number of participants in various months and determining which statement accurately reflects the information shown in the graph.
Answer
The number of participants in the band decreased from October to November.
Answer for screen readers
The number of participants in the band decreased from October to November.
Steps to Solve
- Identify Participants for Each Month
Examine the graph to find the number of participants for each month: September, October, November, and December.
- Record the Values
From the graph, note the participants:
- September: Approximately $70$
- October: Approximately $80$
- November: Approximately $60$
- December: Approximately $50$
- Compare the Values
Now, compare the participants between the months:
- September (70) to November (60): Not the same.
- October (80) to December (50): Not the same.
- October (80) to November (60): Decreased.
- November (60) to December (50): Decreased.
- Evaluate Each Statement
Assess each statement against the observed data:
- The band had the same number of participants in September and November: False.
- The band had the same number of participants in October and December: False.
- The number of participants in the band decreased from October to November: True.
- The number of participants in the band decreased from November to December: True.
- Determine the Best Answer
Select the statement that accurately reflects the data based on the comparisons made.
The number of participants in the band decreased from October to November.
More Information
This answer highlights a decrease in participation, demonstrating changes in participation over time.
Tips
- Misreading Data: Ensure to accurately read the values on the graph.
- Ignoring Decreases: It's crucial to track consistent decreases over time.
- Assuming Equal Values: Avoid assuming the same number of participants without comparison.