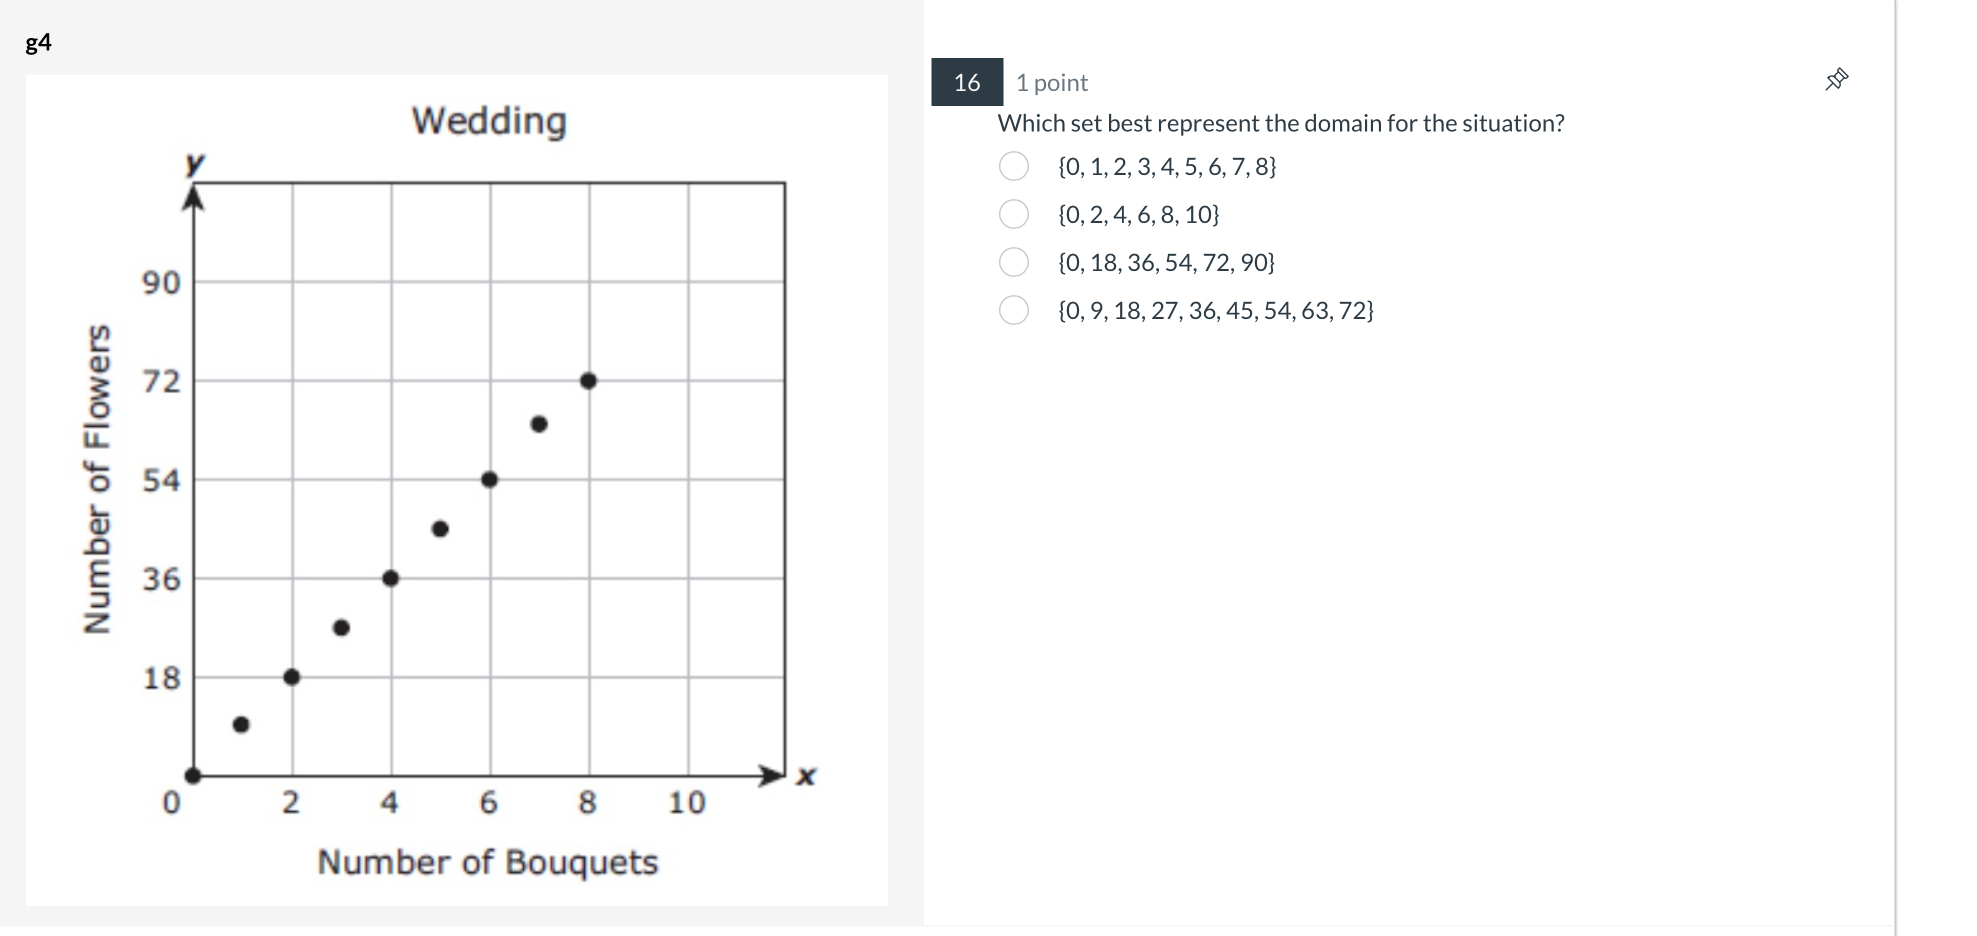
Which set best represents the domain for the situation?

Understand the Problem
The question is asking to identify which set of numbers best represents the domain related to the number of bouquets based on the provided graph. The domain relates to the independent variable (number of bouquets) represented on the x-axis of the graph.
Answer
{0, 2, 4, 6, 8}
Answer for screen readers
The set that best represents the domain is {0, 2, 4, 6, 8}.
Steps to Solve
- Identifying the X-axis Values
Examine the x-axis of the graph, which represents the number of bouquets. The possible values on this axis are integers that indicate how many bouquets are being measured.
- Listing the Valid Points
From the graph, identify the horizontal points where there are data points marked. The visible points correspond to the number of bouquets, which appear to be: 0, 2, 4, 6, and possibly 8.
- Comparing to Given Options
Now, compare the identified values to the provided options for the domain:
- Option 1: {0, 1, 2, 3, 4, 5, 6, 7, 8}
- Option 2: {0, 2, 4, 6, 8, 10}
- Option 3: {0, 18, 36, 54, 72, 90}
- Option 4: {0, 9, 18, 27, 36, 45, 54, 63, 72}
- Evaluating the Options
The correct option should only include the values that appeared on the x-axis in the graph:
- Option 1 includes extraneous values (1, 3, 5, 7).
- Option 2 properly includes 0, 2, 4, 6, and 8.
- Option 3 does not relate to bouquets.
- Option 4 also does not relate to the x-axis values.
- Selecting the Correct Answer
From the analysis, the most suitable choice is Option 2: {0, 2, 4, 6, 8}.
The set that best represents the domain is {0, 2, 4, 6, 8}.
More Information
The set {0, 2, 4, 6, 8} includes the valid integers that represent the number of bouquets depicted on the x-axis. These values are relevant for determining the relationship with the number of flowers.
Tips
- Choosing an option that includes values not represented on the graph (e.g., selecting values like 1, 3, etc.) which results from misunderstanding the plotted points.
- Overlooking the significance of the x-axis when identifying the domain.
AI-generated content may contain errors. Please verify critical information