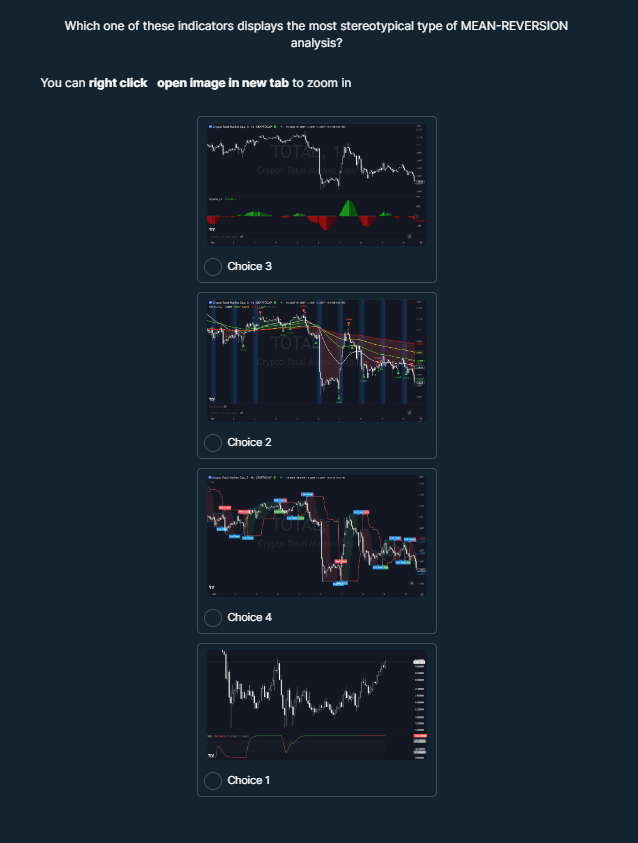
Which one of these indicators displays the most stereotypical type of mean-reversion analysis?

Understand the Problem
The question is asking which of the four provided charts is most representative of mean-reversion analysis in trading. Mean-reversion analysis typically looks for price levels that are likely to revert back to the mean or average.
Answer
Choice 2
The final answer is Choice 2.
Answer for screen readers
The final answer is Choice 2.
More Information
Mean-reversion analysis often uses indicators like Moving Averages and Bollinger Bands to signal when prices are expected to return to the mean.
Tips
Avoid confusing momentum indicators with mean-reversion ones. Mean-reversion focuses on returning to an average value.
Sources
- Mean Reversion Indicators - CliffsNotes - cliffsnotes.com
- Mean Reversion Analysis - Investopedia - investopedia.com
AI-generated content may contain errors. Please verify critical information