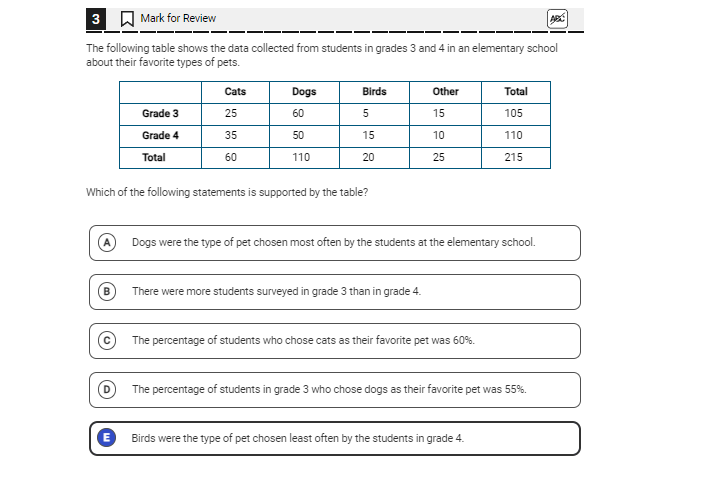
Which of the following statements is supported by the table?

Understand the Problem
The question is asking us to analyze a table that contains data about students' favorite pets in grades 3 and 4, and determine which statement is supported by the information presented. We'll need to evaluate each option against the data in the table to find the correct answer.
Answer
A
Answer for screen readers
The statement supported by the table is A: Dogs were the type of pet chosen most often by the students at the elementary school.
Steps to Solve
-
Calculate Total Pet Choices for Each Type
We need to sum the total number of students who chose each type of pet from the table.
- Cats: $25 + 35 = 60$
- Dogs: $60 + 50 = 110$
- Birds: $5 + 15 = 20$
- Other: $15 + 10 = 25$
-
Analyze Statement A: Dogs were the type of pet chosen most often
Compare the total for each pet type:
- Cats: 60
- Dogs: 110
- Birds: 20
- Other: 25
Since $110 > 60$, the statement is TRUE.
-
Analyze Statement B: More students surveyed in grade 3 than in grade 4
Compare the total students surveyed:
- Grade 3: 105
- Grade 4: 110
Since $105 < 110$, this statement is FALSE.
-
Analyze Statement C: Percentage of students who chose cats as their favorite pet was 60%
Calculate the percentage: [ \text{Percentage} = \frac{\text{Total Cats}}{\text{Total Students}} \times 100 = \frac{60}{215} \times 100 \approx 27.91% ] This statement is FALSE.
-
Analyze Statement D: Percentage of students in grade 3 who chose dogs as their favorite pet was 55%
Calculate the percentage specifically for grade 3: [ \text{Percentage} = \frac{60}{105} \times 100 \approx 57.14% ] This statement is FALSE.
-
Analyze Statement E: Birds were the type of pet chosen least often by students in grade 4
For grade 4, we have:
- Birds: 15
- Compare with other pets:
- Cats: 35
- Dogs: 50
- Other: 10
Since $15 > 10$, but less than both Cats and Dogs, this statement is TRUE. However, it is not the least chosen overall, as Other has only 10.
The statement supported by the table is A: Dogs were the type of pet chosen most often by the students at the elementary school.
More Information
The table shows distinct preferences in pet types among students in grades 3 and 4. The data indicates that more students favored dogs over cats, birds, and other options.
Tips
- Miscalculating totals for each type of pet by not summing across grades.
- Incorrectly interpreting percentage calculations, especially when it comes to total students surveyed.
AI-generated content may contain errors. Please verify critical information