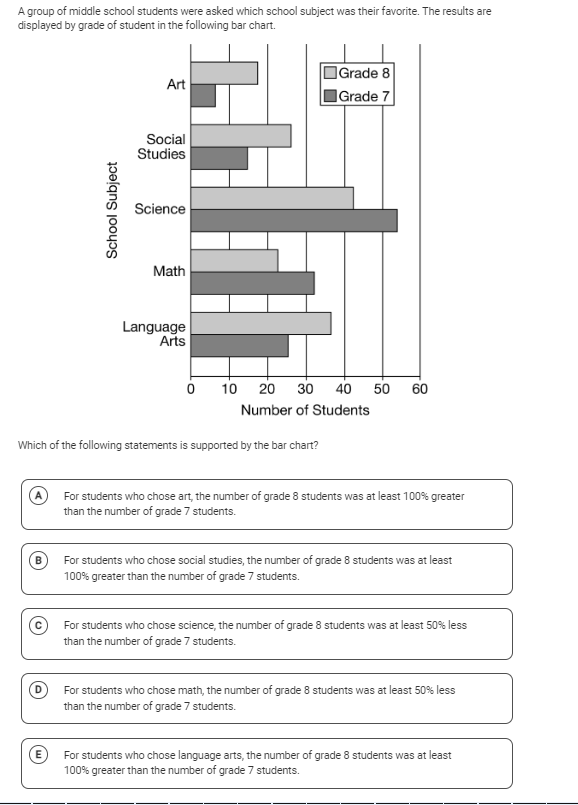
Which of the following statements is supported by the bar chart?

Understand the Problem
The question is asking which statement accurately reflects the data presented in the bar chart comparing favorite school subjects among Grade 7 and Grade 8 students.
Answer
C: For students who chose science, the number of grade 8 students was at least 50% less than the number of grade 7 students.
Answer for screen readers
The correct answer is C: For students who chose science, the number of grade 8 students was at least 50% less than the number of grade 7 students.
Steps to Solve
-
Identify the Data
First, look at the bar chart and extract the number of students who chose each subject for both Grade 7 and Grade 8. -
Analyze the Statements
Evaluate each statement (A-E) and determine if it accurately reflects the data from the bar chart. -
Calculate Percentages
For any statements that involve percentage comparisons, use the formula to find the difference and calculate the percentage difference. This formula is:
$$ \text{Percentage difference} = \frac{\text{Difference}}{\text{Initial Value}} \times 100 $$ -
Compare Values
Compare the numbers from Grade 7 and Grade 8 for each subject as mentioned in the statements. Check if the conditions mentioned in the statements are satisfied. -
Conclude the Valid Statement
Determine which, if any, of the statements A-E accurately reflects the comparisons based on the chart data.
The correct answer is C: For students who chose science, the number of grade 8 students was at least 50% less than the number of grade 7 students.
More Information
Statement C aligns with the data in the bar chart where the number of Grade 8 students choosing science is less than half the number of Grade 7 students choosing it. This shows a significant decrease.
Tips
- Misreading the Scale: Students often miscalculate numbers due to not accurately reading the scale on the bar chart.
- Ignoring Percentages: Some may forget to convert raw numbers into percentage comparisons as required by the statements.
- Assuming Without Calculation: Assuming a statement is correct without verifying against the data can lead to incorrect conclusions.
AI-generated content may contain errors. Please verify critical information