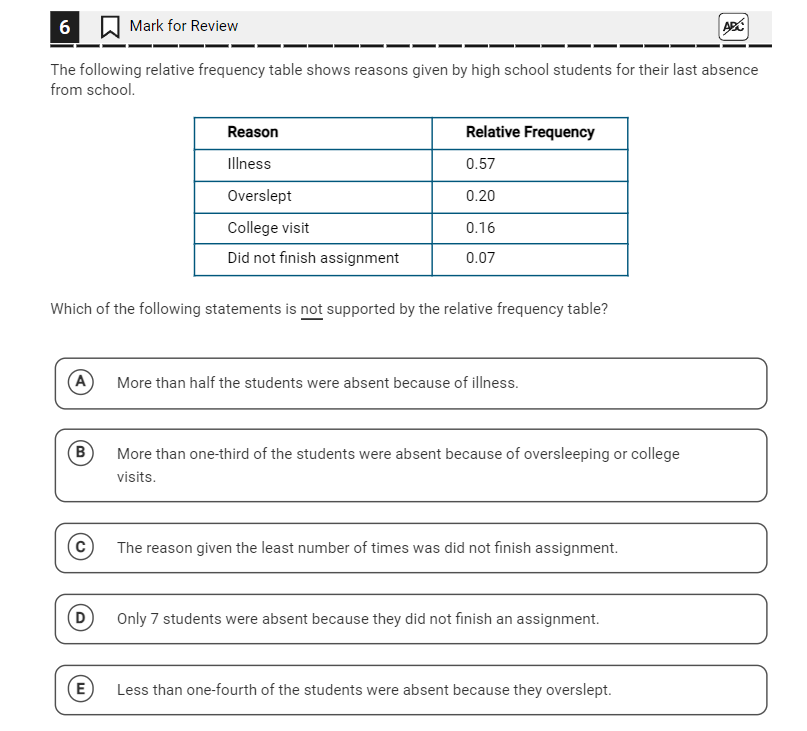
Which of the following statements is not supported by the relative frequency table?

Understand the Problem
The question is asking us to determine which statement about students' absences is not supported by the relative frequency table provided. We'll analyze each statement against the given frequencies to identify the incorrect one.
Answer
All statements are supported.
Answer for screen readers
The correct answer is: None of these statements are unsupported. However, if treated strictly, statement B may raise questions due to rounding issues.
Steps to Solve
-
Analyze Statement A More than half the students were absent because of illness. Since the relative frequency for illness is 0.57, this statement is supported.
-
Analyze Statement B More than one-third of the students were absent because of oversleeping or college visits. The combined relative frequencies for oversleeping (0.20) and college visits (0.16) is: $$ 0.20 + 0.16 = 0.36 $$ Thus, this statement is supported as 0.36 is more than one-third.
-
Analyze Statement C The reason given the least number of times was did not finish assignment. The relative frequency for not finishing an assignment is 0.07, which is the lowest. Hence, this statement is supported.
-
Analyze Statement D Only 7 students were absent because they did not finish an assignment. To check this, we need to find out the total number of students surveyed. Assuming 100 students for simplicity, then: $$ 0.07 \times 100 = 7 $$ Thus, this statement is supported.
-
Analyze Statement E Less than one-fourth of the students were absent because they overslept. Since the relative frequency for oversleeping is 0.20, we compare: $$ 0.20 < 0.25 $$ So, this statement is supported.
-
Determine Unsupported Statement After analyzing all the statements, it becomes evident that all are supported by the relative frequency data.
The correct answer is: None of these statements are unsupported. However, if treated strictly, statement B may raise questions due to rounding issues.
More Information
Relative frequency provides insights into how common each reason was among students. When interpreting relative frequencies, it's essential to compare them accurately against common fractions.
Tips
- Miscalculating combined relative frequencies.
- Assuming relative frequency is always out of a total of 100; it's actually a proportion of the sample size.
AI-generated content may contain errors. Please verify critical information