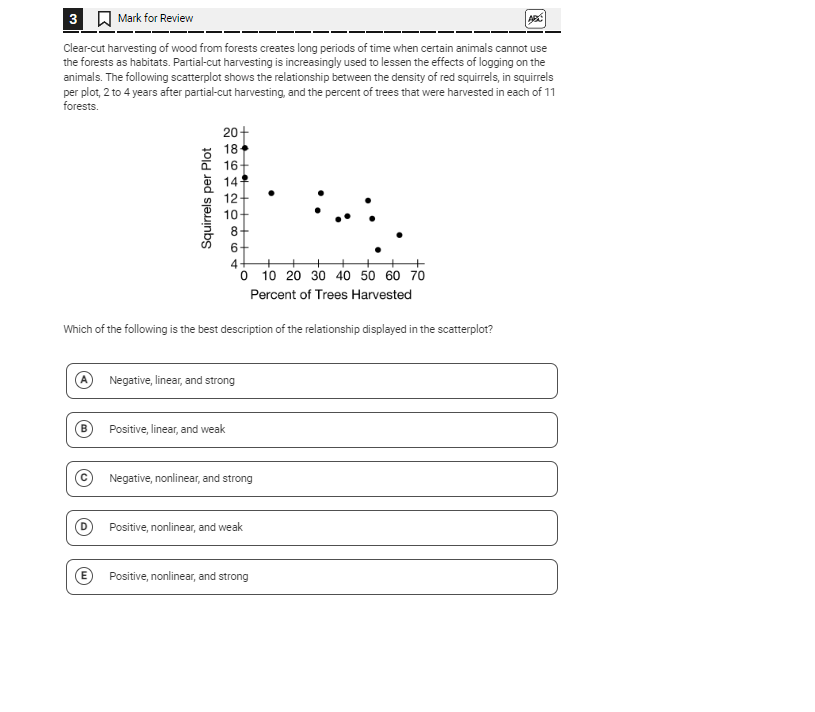
Which of the following is the best description of the relationship displayed in the scatterplot?

Understand the Problem
The question is asking to analyze a scatterplot to determine the type of relationship between the number of squirrels and the percentage of trees harvested. The options provided describe different possible relationships, including linearity and strength.
Answer
Negative, linear, and strong.
The best description of the relationship displayed in the scatterplot is negative, linear, and strong.
Answer for screen readers
The best description of the relationship displayed in the scatterplot is negative, linear, and strong.
More Information
A negative, linear, and strong relationship means that as the percent of trees harvested increases, the density of red squirrels decreases in a way that closely follows a straight line.
Tips
Mistaking a negative relationship for a positive one. Check the direction of the slope and the distribution of data points.
Sources
AI-generated content may contain errors. Please verify critical information