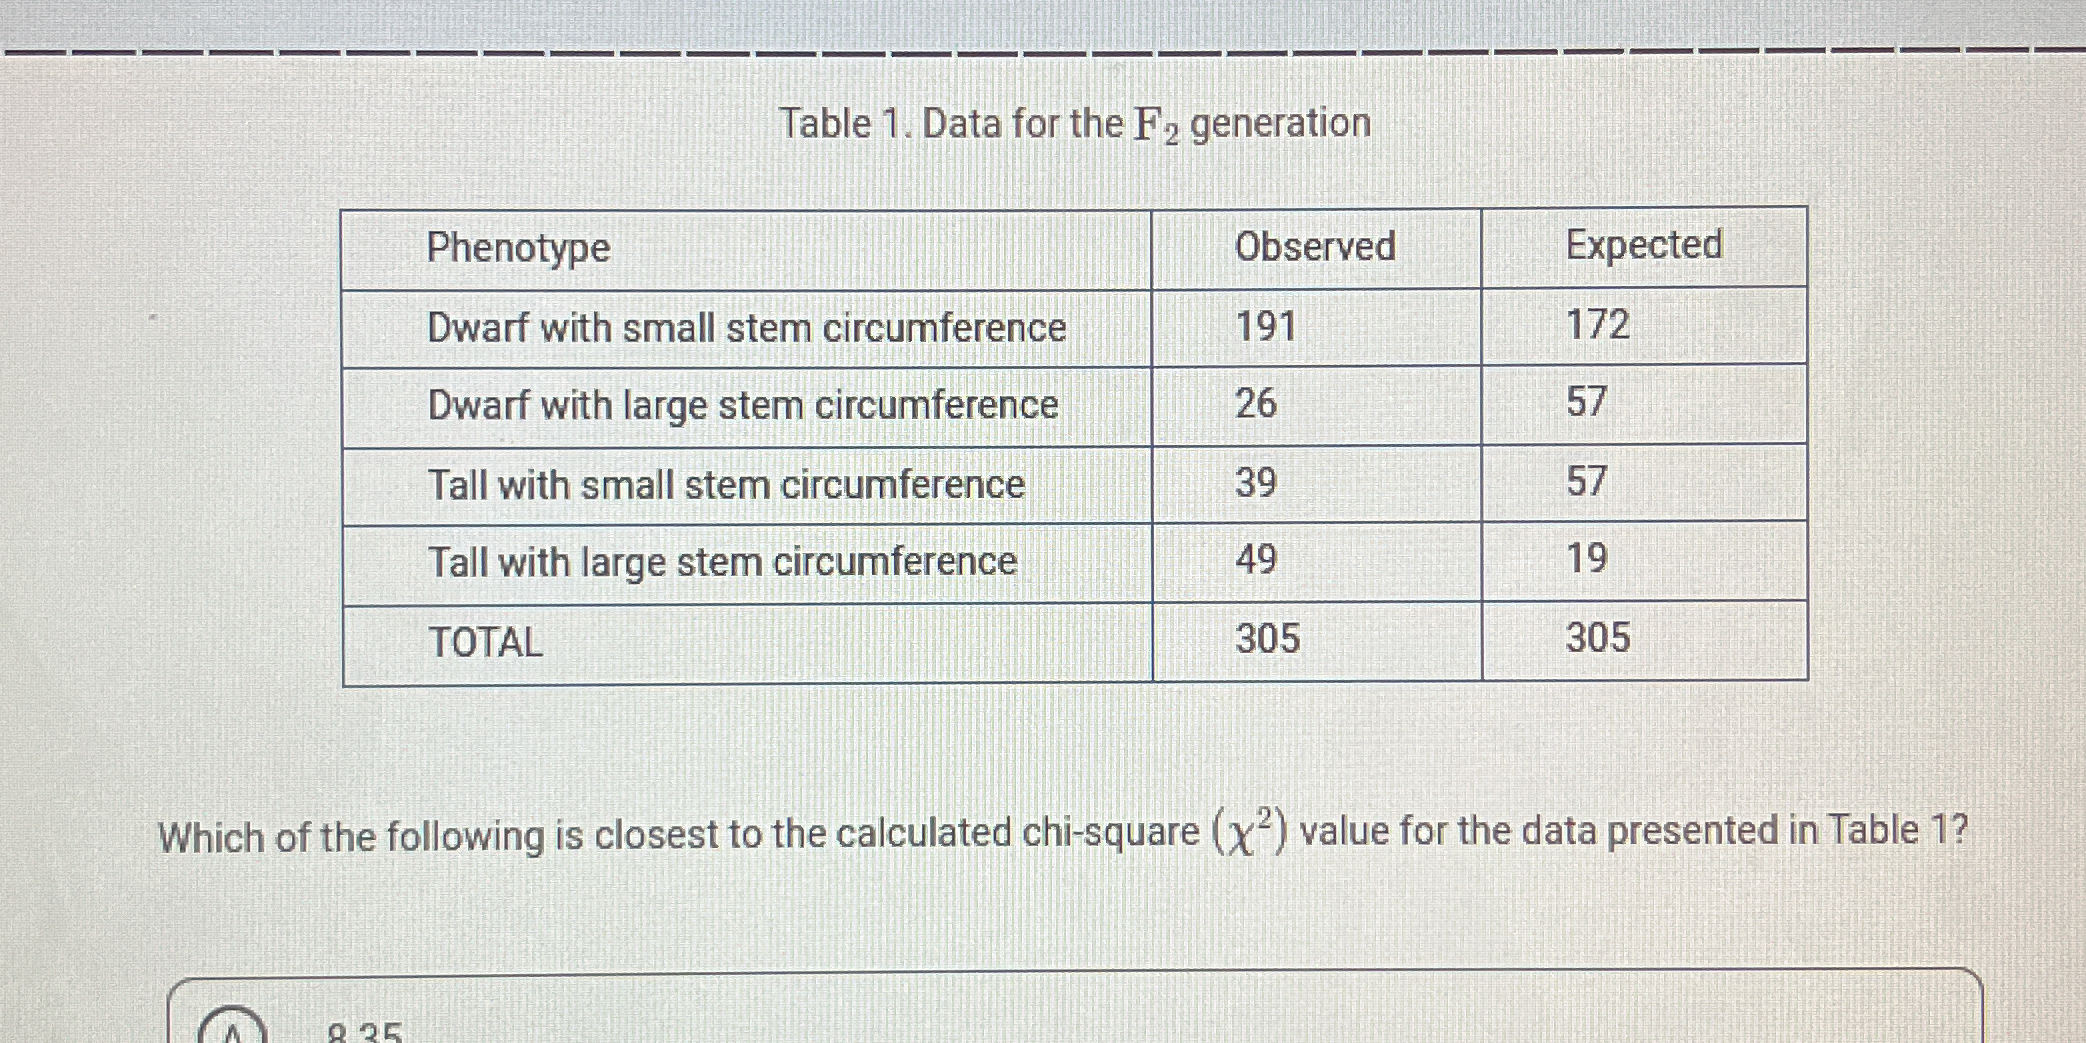
Which of the following is closest to the calculated chi-square (χ²) value for the data presented in Table 1?

Understand the Problem
The question is asking for the calculated chi-square (
χ
2 ) value based on the observed and expected frequencies of different phenotypes presented in the table. To solve it, we will use the chi-square formula, which involves summing the squared differences between observed and expected values, divided by the expected values.
Answer
The calculated chi-square value is $\chi^2 \approx 72.02$.
Answer for screen readers
The calculated chi-square ($\chi^2$) value is approximately 72.02.
Steps to Solve
- Identify the Observed and Expected Frequencies
From the table, the observed (O) and expected (E) frequencies for each phenotype are:
- Dwarf with small stem circumference: O = 191, E = 172
- Dwarf with large stem circumference: O = 26, E = 57
- Tall with small stem circumference: O = 39, E = 57
- Tall with large stem circumference: O = 49, E = 19
- Apply the Chi-Square Formula
The chi-square ($\chi^2$) statistic can be calculated using the formula:
$$ \chi^2 = \sum \frac{(O - E)^2}{E} $$
Here, we will calculate the contributions for each phenotype.
- Calculate Each Component
-
For Dwarf with small stem circumference: $$ \frac{(191 - 172)^2}{172} = \frac{19^2}{172} = \frac{361}{172} \approx 2.1 $$
-
For Dwarf with large stem circumference: $$ \frac{(26 - 57)^2}{57} = \frac{(-31)^2}{57} = \frac{961}{57} \approx 16.87 $$
-
For Tall with small stem circumference: $$ \frac{(39 - 57)^2}{57} = \frac{(-18)^2}{57} = \frac{324}{57} \approx 5.68 $$
-
For Tall with large stem circumference: $$ \frac{(49 - 19)^2}{19} = \frac{30^2}{19} = \frac{900}{19} \approx 47.37 $$
- Sum All Components to Find the Chi-Square Value
Now, sum the calculated components:
$$ \chi^2 \approx 2.1 + 16.87 + 5.68 + 47.37 \approx 72.02 $$
The calculated chi-square ($\chi^2$) value is approximately 72.02.
More Information
The chi-square test is often used in genetics to compare observed and expected data to assess whether any significant differences exist. A high chi-square value indicates a larger deviation between observed and expected frequencies.
Tips
- Miscalculating Squared Differences: Make sure to square the difference between observed and expected values accurately.
- Forgetting to Sum All Components: It’s essential to include contributions from all categories before arriving at the final chi-square value.
- Incorrectly Using the Formula: Ensure that the formula is applied correctly and consistently for each phenotype.
AI-generated content may contain errors. Please verify critical information