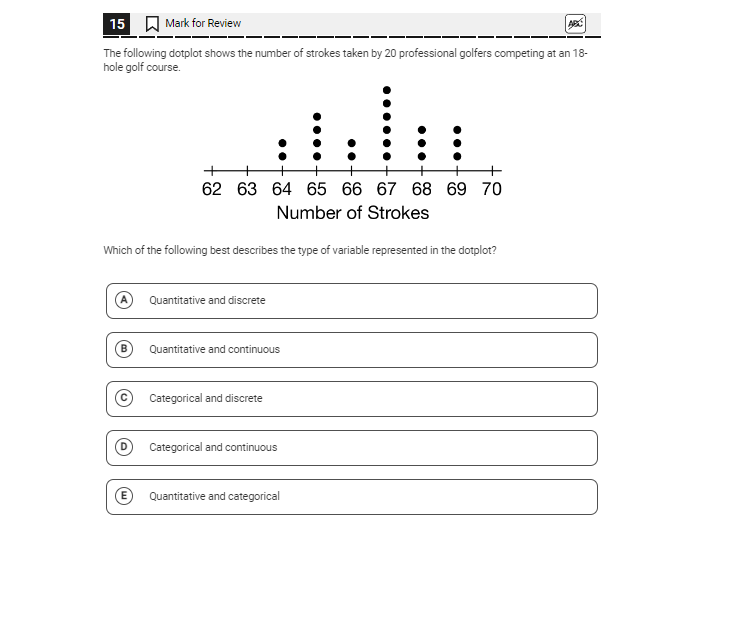
Which of the following best describes the type of variable represented in the dotplot?

Understand the Problem
The question asks for the best description of the type of variable represented in a dotplot of strokes taken by professional golfers. The options provided include various classifications of the variable, which could be quantitative or categorical, and discrete or continuous.
Answer
Quantitative and discrete.
The best description for the type of variable represented in the dotplot is Quantitative and discrete.
Answer for screen readers
The best description for the type of variable represented in the dotplot is Quantitative and discrete.
More Information
In statistics, quantitative discrete data involve countable quantities that can only take specific integer values. The number of strokes in golf fits this criterion perfectly.
Tips
A common mistake is interpreting data that can only take whole number values (like counts) as continuous.
Sources
- Types of Data - Math Steps, Examples & Questions - thirdspacelearning.com
- Solved: Which of the following best describes the type of variable ... - gauthmath.com
AI-generated content may contain errors. Please verify critical information