Which inequality is graphed on the coordinate plane?

Understand the Problem
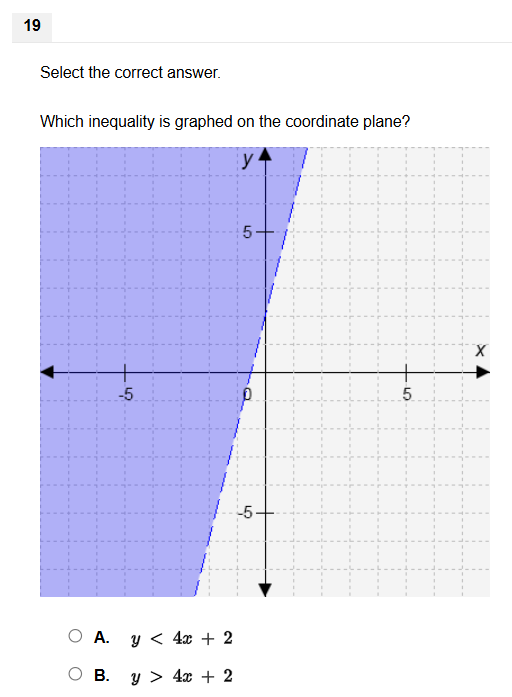
The question is asking which inequality is represented by the shaded region in the coordinate plane. The graph indicates an area above or below a line, which can be determined by analyzing the given inequalities.
Answer
The inequality is $y > 4x + 2$.
Answer for screen readers
The inequality graphed on the coordinate plane is $y > 4x + 2$.
Steps to Solve
-
Identify the line from the equation First, recognize the inequality options. The line is given by the equation $y = 4x + 2$. This line divides the plane into two regions.
-
Determine the direction of the inequality Since the shaded region is on top of the line, it implies that we are looking for the region where $y$ is greater than the line. Thus, the inequality is $y > 4x + 2$.
-
Check shading and line type If the line is dashed, it indicates that points on the line are not included in the solution (non-inclusive inequality). If solid, then it's included. The graph indicates a dashed line for $y = 4x + 2$.
-
Final Inequality Conclusion From the above observations, we confirm the inequality that correctly represents the shaded region is $y > 4x + 2$.
The inequality graphed on the coordinate plane is $y > 4x + 2$.
More Information
The line $y = 4x + 2$ has a slope of 4, meaning for each unit increase in $x$, $y$ increases by 4 units. This inequality describes all points above this line.
Tips
- Confusing the direction of inequality: Sometimes, people mistake the region above or below the line. Always check where the shading is relative to the line.
- Mistaking dashed vs. solid lines: A dashed line indicates that the values along the line are not included in the solution, while a solid line includes them.
AI-generated content may contain errors. Please verify critical information