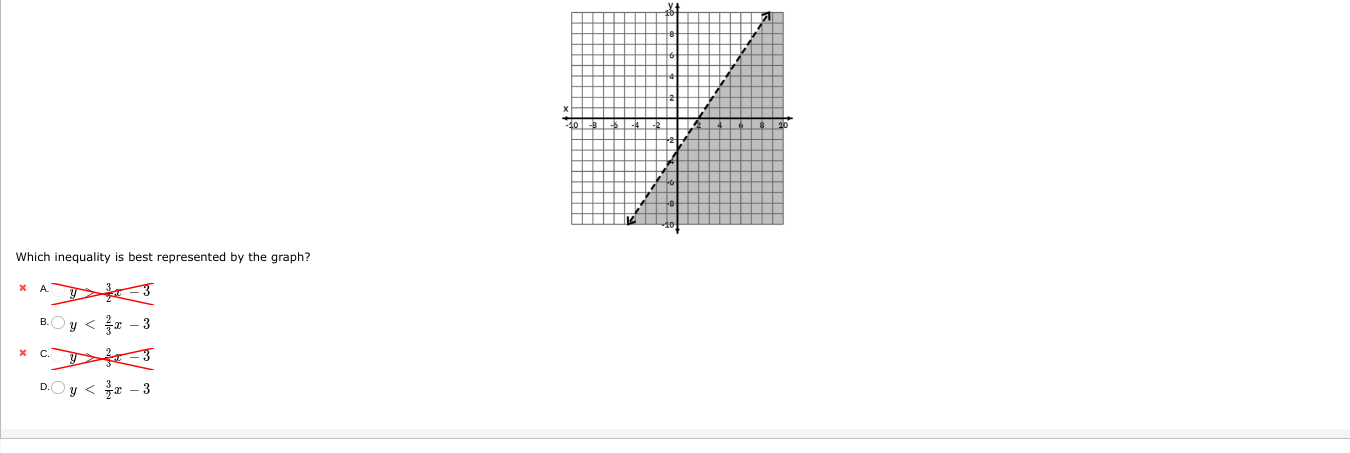
Which inequality is best represented by the graph?

Understand the Problem
The question is asking to identify the correct inequality that corresponds to the graph shown. The graph appears to represent a region above a specific linear equation, and we need to determine from the options provided which inequality that represents that area.
Answer
None of the listed inequalities accurately represent the graph.
Answer for screen readers
None of the listed inequalities accurately represent the graph.
Steps to Solve
-
Identify the line represented in the graph The graph shows a dashed line, which indicates that the inequality is not inclusive (i.e., it does not include the points on the line). The line itself can be represented by the equation $y = \frac{3}{2}x - 3$.
-
Determine the region represented by the inequality The shaded area is above the line, which indicates that we are looking for inequalities where $y$ is greater than the line’s equation.
-
Express the inequalities based on the options From the options:
- A: $y < \frac{3}{2}x - 3$
- B: $y < \frac{2}{3}x - 3$
- C: $y \geq \frac{3}{2}x - 3$
- D: $y < \frac{3}{2}x - 3$
Since the shaded area is above the line, we want to select the inequality that uses $>$ rather than $<$.
- Select the correct inequality From the analysis, the only correct option indicating that $y$ is above the line is the reverse of A or D, or none of the options because they all indicate $<$. Therefore, it looks like an error in the options provided.
None of the listed inequalities accurately represent the graph.
More Information
In inequalities involving graphs, a dashed line indicates that the boundary is not included in the solution set. The correct notation would express that $y$ is greater than the line $y = \frac{3}{2}x - 3$.
Tips
- Confusing dashed and solid lines: A dashed line indicates that points on the line are not included in the solution, so do not select inequalities that use $\leq$ or $\geq$.
- Selecting the wrong inequality direction: Ensure to choose inequalities that correctly represent the shaded area in relation to the line.
AI-generated content may contain errors. Please verify critical information