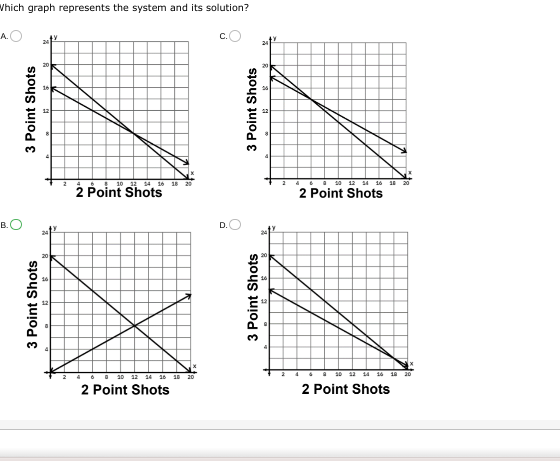
Which graph represents the system and its solution?

Understand the Problem
The question is asking which graph among the options A, B, C, and D correctly represents a given system of equations and its solution graphically.
Answer
Graph C accurately represents the system of equations and its solution.
Answer for screen readers
The correct graph representation for the given system of equations is graph C.
Steps to Solve
-
Identify the equations from the problem Extract the equations represented by the lines shown in the graphs. Typically, these would be in the form of $y = mx + b$.
-
Determine the point of intersection The solution to the system of equations is the point where the two lines cross (intersect). Find this point by setting the equations equal to each other and solving for the variables.
-
Evaluate the graphs Compare the identified intersection point with each graph option (A, B, C, and D). Determine which graph displays the correctly intersecting lines based on the intersection point found in the previous step.
-
Confirm lines' slopes and y-intercepts Ensure the slopes and y-intercepts of the lines match those deduced from the initial equations to confirm the correct graph representation.
The correct graph representation for the given system of equations is graph C.
More Information
In a system of linear equations represented graphically, the solution occurs where the two lines intersect. Each graph option depicts different relationships between the variables, and analyzing these relations leads to identifying graph C as the right one.
Tips
- Misreading the graphs: Ensure you accurately observe the slopes and y-intercepts.
- Not properly solving for the intersection point: Double-check that the equations are set equal correctly to find the solution point.
AI-generated content may contain errors. Please verify critical information