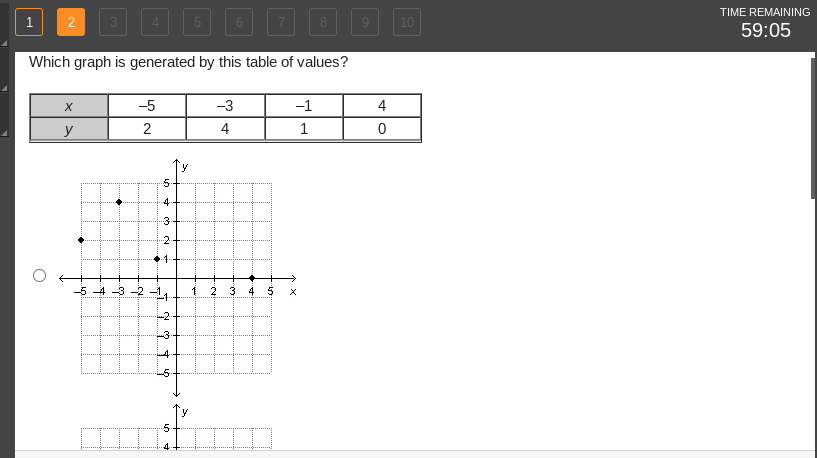
Which graph is generated by this table of values?

Understand the Problem
The question is asking which graph corresponds to a given table of x and y values, specifically looking for the graph that represents the coordinates derived from those values.
Answer
The answer is the graph containing the points $(-5, 2)$, $(-3, 4)$, $(-1, 1)$, and $(4, 0)$.
Answer for screen readers
The graph that corresponds to the table of values is the one that contains the points $(-5, 2)$, $(-3, 4)$, $(-1, 1)$, and $(4, 0)$.
Steps to Solve
- Identify the data points from the table
From the given table, extract the pairs of $(x, y)$ values:
- $(-5, 2)$
- $(-3, 4)$
- $(-1, 1)$
- $(4, 0)$
- Plot each point on the coordinate graph
Begin plotting each point on the graph:
- For $(-5, 2)$, go left to -5 on the x-axis and up to 2 on the y-axis.
- For $(-3, 4)$, go left to -3 on the x-axis and up to 4 on the y-axis.
- For $(-1, 1)$, go left to -1 on the x-axis and up to 1 on the y-axis.
- For $(4, 0)$, go right to 4 on the x-axis and stay on the x-axis for y value of 0.
- Connect the points or match to given graphs
Once all points are plotted, check which graph corresponds to the plotted points:
- Look for a graph that contains the exact points $(-5, 2)$, $(-3, 4)$, $(-1, 1)$, and $(4, 0)$.
The graph that corresponds to the table of values is the one that contains the points $(-5, 2)$, $(-3, 4)$, $(-1, 1)$, and $(4, 0)$.
More Information
The plotted points form a specific arrangement in the Cartesian plane, and identifying the correct graph requires checking that all these points appear correctly on the provided graph options.
Tips
- Misreading or misplotting the coordinates can lead to selecting the wrong graph.
- Skipping to connect the points might cause confusion in visualizing the relationship of the points.