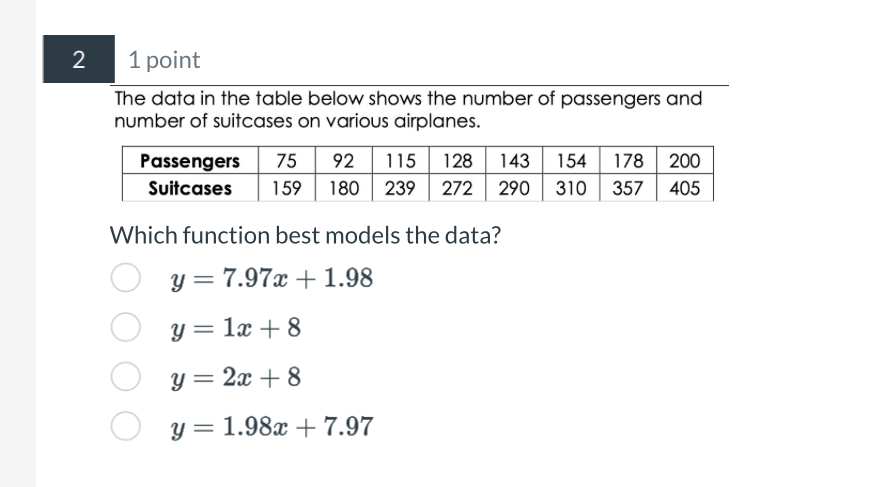
Which function best models the data?

Understand the Problem
The question is asking to identify which of the given functions best represents the relationship between the number of passengers and the number of suitcases based on the provided data.
Answer
The best model is \( y = 7.97x + 1.98 \).
Answer for screen readers
The function that best models the data is:
$$ y = 7.97x + 1.98 $$
Steps to Solve
-
Identify the Variables
Let ( x ) be the number of passengers and ( y ) be the number of suitcases.
-
Plot the Data
Represent the data points from the table as ordered pairs:
((75, 159), (92, 180), (115, 239), (128, 272), (143, 290), (154, 310), (178, 357), (200, 405)) -
Find Slope and Y-intercept
Use the formula for linear regression or a calculator to find the best fit line. The slope ( m ) can be estimated using the formula:
$$ m = \frac{N(\sum xy) - (\sum x)(\sum y)}{N(\sum x^2) - (\sum x)^2} $$
And the y-intercept ( b ) can be estimated using:
$$ b = \frac{\sum y - m(\sum x)}{N} $$
-
Calculate Necessary Sums
Calculate the necessary sums:
- ( \sum x )
- ( \sum y )
- ( \sum xy )
- ( \sum x^2 )
-
Determine the Best Fit Function
After calculating the slope ( m ) and the y-intercept ( b ), combine them to form the equation ( y = mx + b ) and compare it with the given functions.
-
Select the Closest Function
Identify which of the given functions best matches the calculated function.
The function that best models the data is:
$$ y = 7.97x + 1.98 $$
More Information
The equation ( y = 7.97x + 1.98 ) suggests that for each additional passenger, about 7.97 suitcases are expected. This is a linear relationship indicating that as the number of passengers increases, the number of suitcases increases proportionally.
Tips
null
AI-generated content may contain errors. Please verify critical information