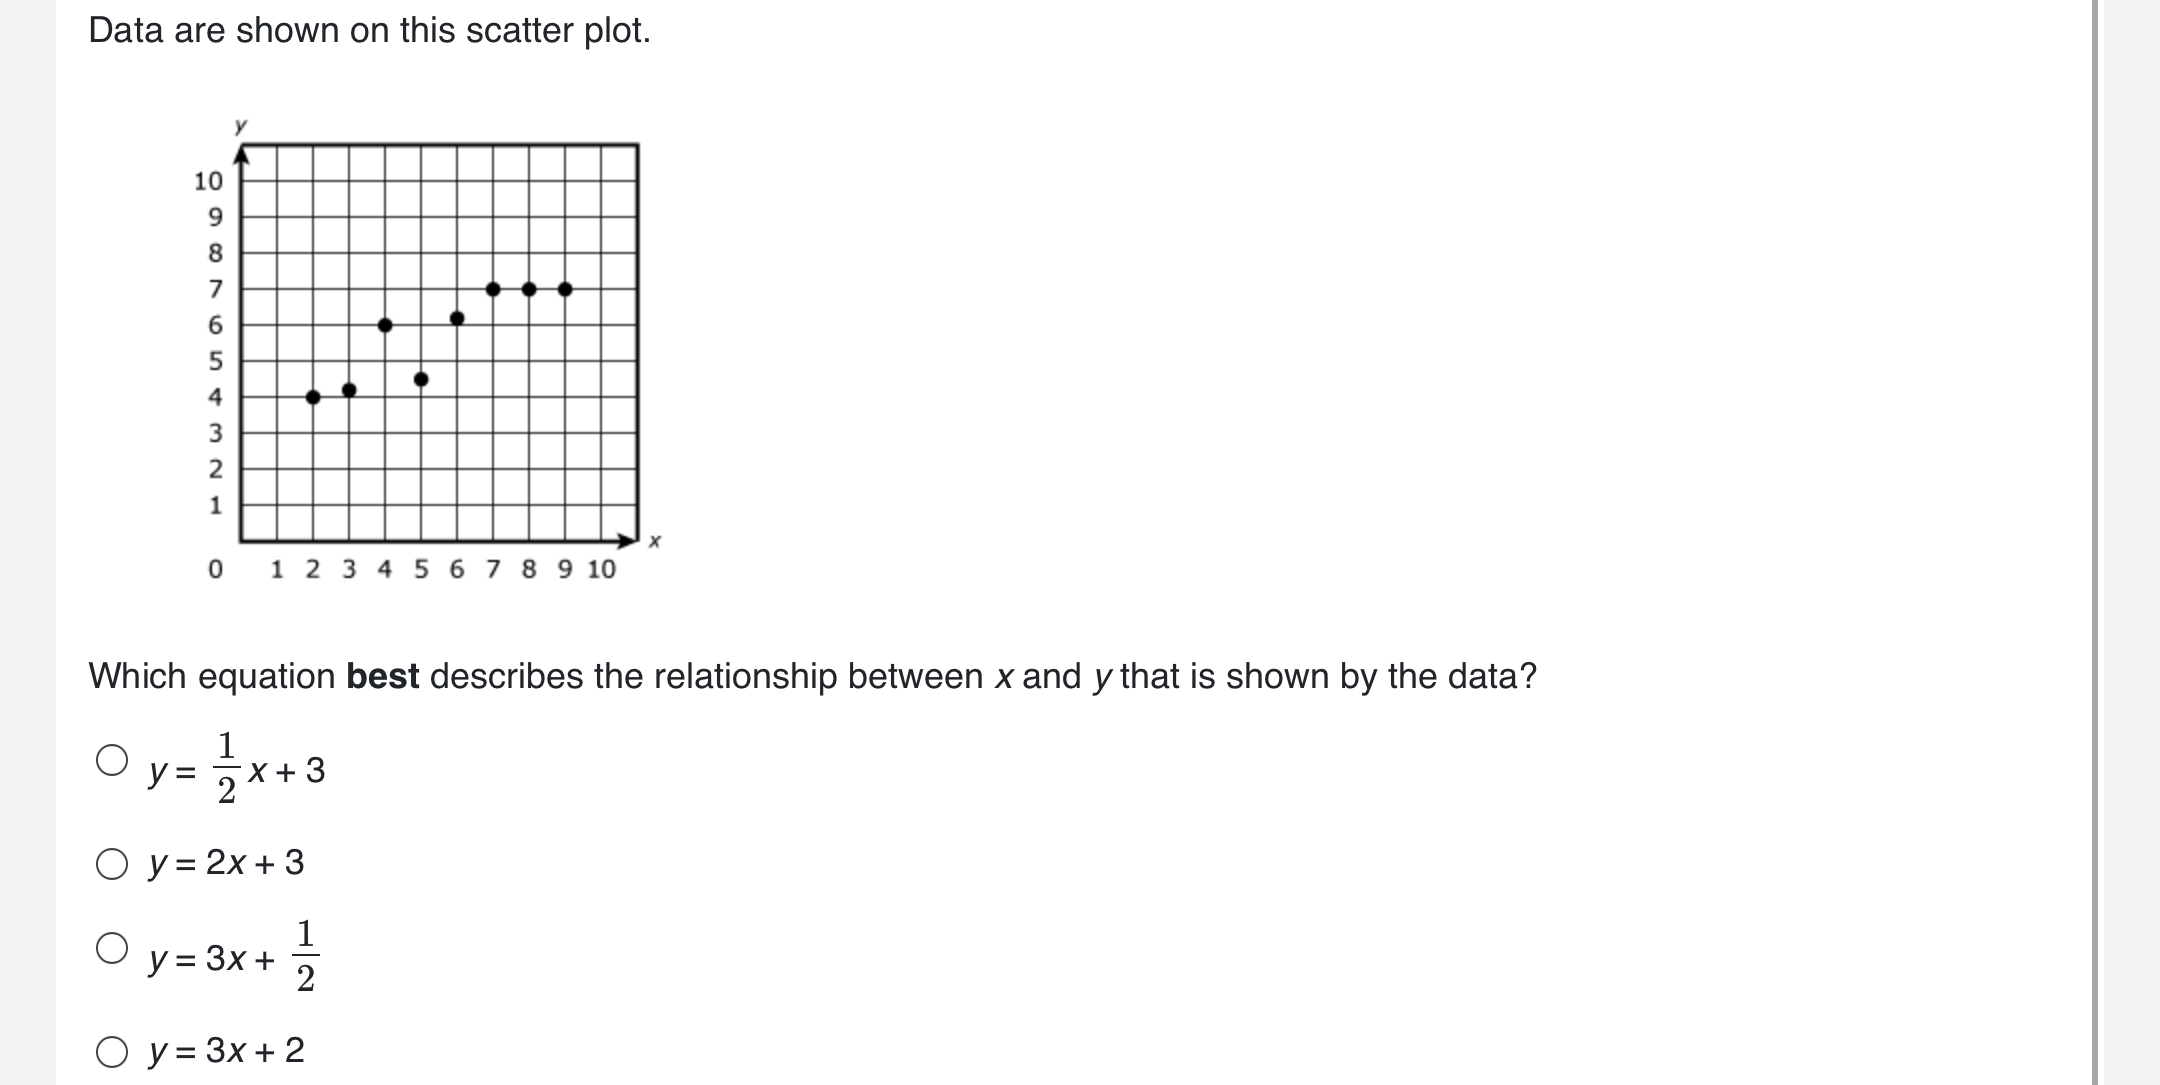
Which equation best describes the relationship between x and y that is shown by the data?

Understand the Problem
The question is asking which equation best represents the relationship between x and y based on the data presented in the scatter plot. We'll analyze the given options and determine the best fit linear equation for the plotted points.
Answer
The equation is \( y = 2x + 3 \).
Answer for screen readers
The best equation that describes the relationship is ( y = 2x + 3 ).
Steps to Solve
-
Identify Data Points Observe the scatter plot and identify some clear data points (coordinates) based on the plots presented. For instance, if you see points like (2, 4) and (4, 6), note these down.
-
Calculate the Slope (m) Using two data points, calculate the slope using the formula: $$ m = \frac{y_2 - y_1}{x_2 - x_1} $$ For example, if you choose points (2, 4) and (4, 6): $$ m = \frac{6 - 4}{4 - 2} = \frac{2}{2} = 1 $$
-
Find the y-Intercept (b) Use one of the points and the slope you calculated to find the y-intercept ( b ) using the equation of a line: $$ y = mx + b $$ Plugging in one of the points, say (2, 4): $$ 4 = 1(2) + b $$ This simplifies to: $$ b = 4 - 2 = 2 $$
-
Write the Linear Equation With the slope ( m ) and the y-intercept ( b ) calculated, write the equation of the line: $$ y = mx + b $$ Substituting ( m = 1 ) and ( b = 2 ): $$ y = 1x + 2 $$
-
Compare to Given Options Now compare the derived equation ( y = x + 2 ) with the provided options to check which is closest. The available options are:
- ( y = \frac{1}{2}x + 3 )
- ( y = 2x + 3 )
- ( y = 3x + \frac{1}{2} )
- ( y = 3x + 2 )
-
Select the Best Fit Choose the option that has a slope and y-intercept that best matches your derived equation. If none match perfectly, the option that aligns with the overall trend from the scatter plot should be chosen.
The best equation that describes the relationship is ( y = 2x + 3 ).
More Information
This equation suggests that for every 1 unit increase in ( x ), ( y ) increases by 2 units, starting from 3 when ( x = 0 ). It reflects a steep positive correlation as seen in the scatter plot.
Tips
- Ignoring units on the axes of the scatter plot can lead to incorrect identification of slope or y-intercept.
- Overlooking to check all options carefully can result in selecting an incorrect equation. Always compare derived equations with all given options.
AI-generated content may contain errors. Please verify critical information