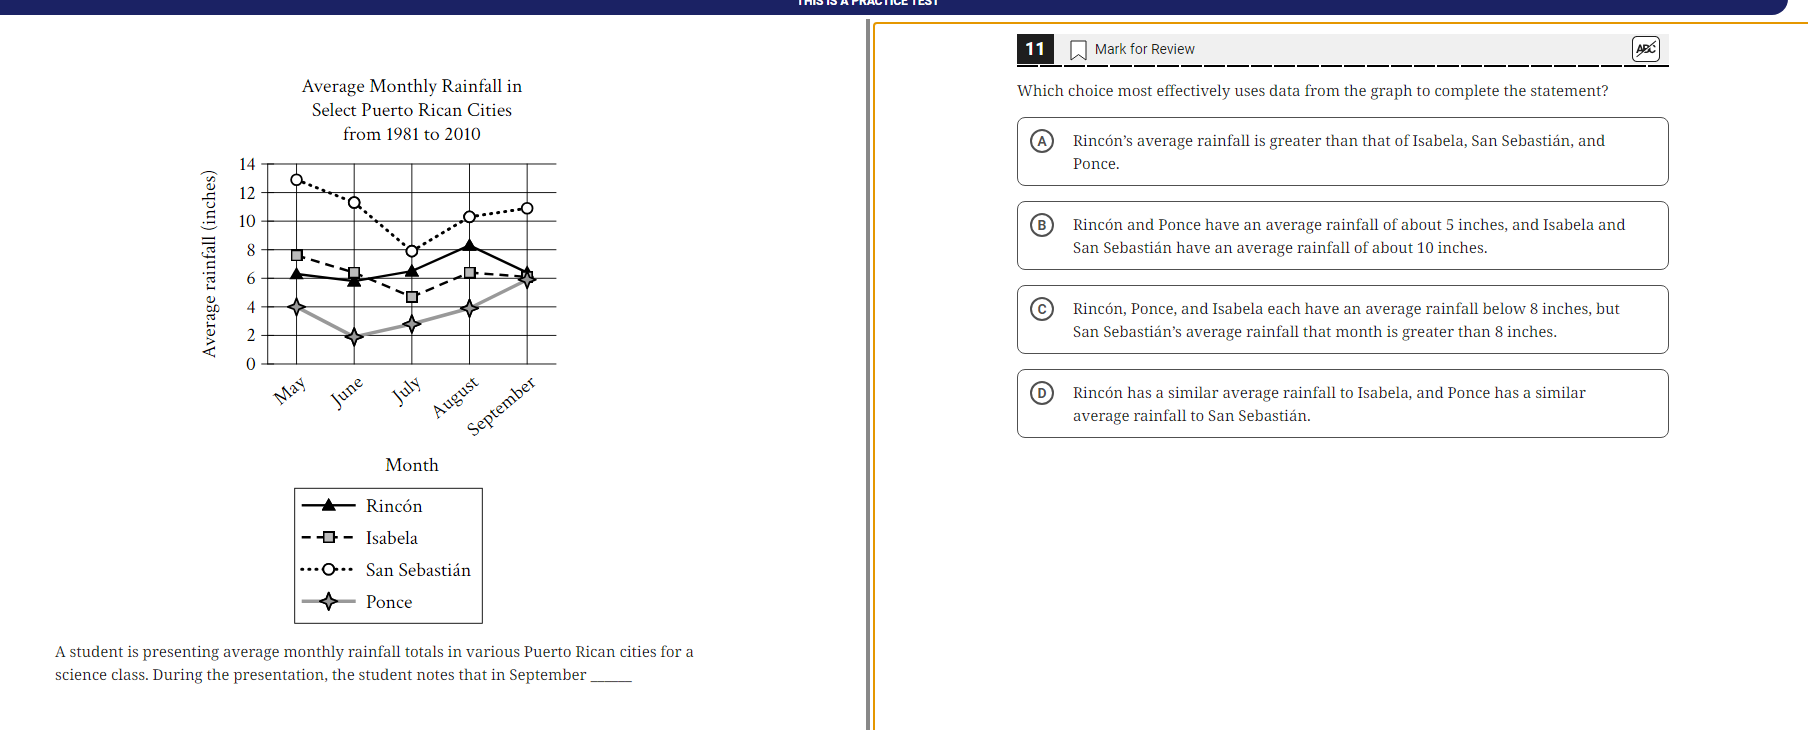
Which choice most effectively uses data from the graph to complete the statement?

Understand the Problem
The question is asking for the choice that best summarizes the rainfall data presented in the graph. It requires analyzing the graph and the options provided to identify which statement accurately reflects the average rainfall in the specified Puerto Rican cities for September.
Answer
Choice C is the correct answer.
The final answer is choice C: Rincón, Ponce, and Isabela each have an average rainfall below 8 inches, but San Sebastián’s average rainfall that month is greater than 8 inches.
Answer for screen readers
The final answer is choice C: Rincón, Ponce, and Isabela each have an average rainfall below 8 inches, but San Sebastián’s average rainfall that month is greater than 8 inches.
More Information
Choice C accurately describes the data for September, showing that three cities have less than 8 inches while San Sebastián has more.
Tips
A common mistake is misreading the graph data for each city. Ensure you compare each city's rainfall correctly.
AI-generated content may contain errors. Please verify critical information