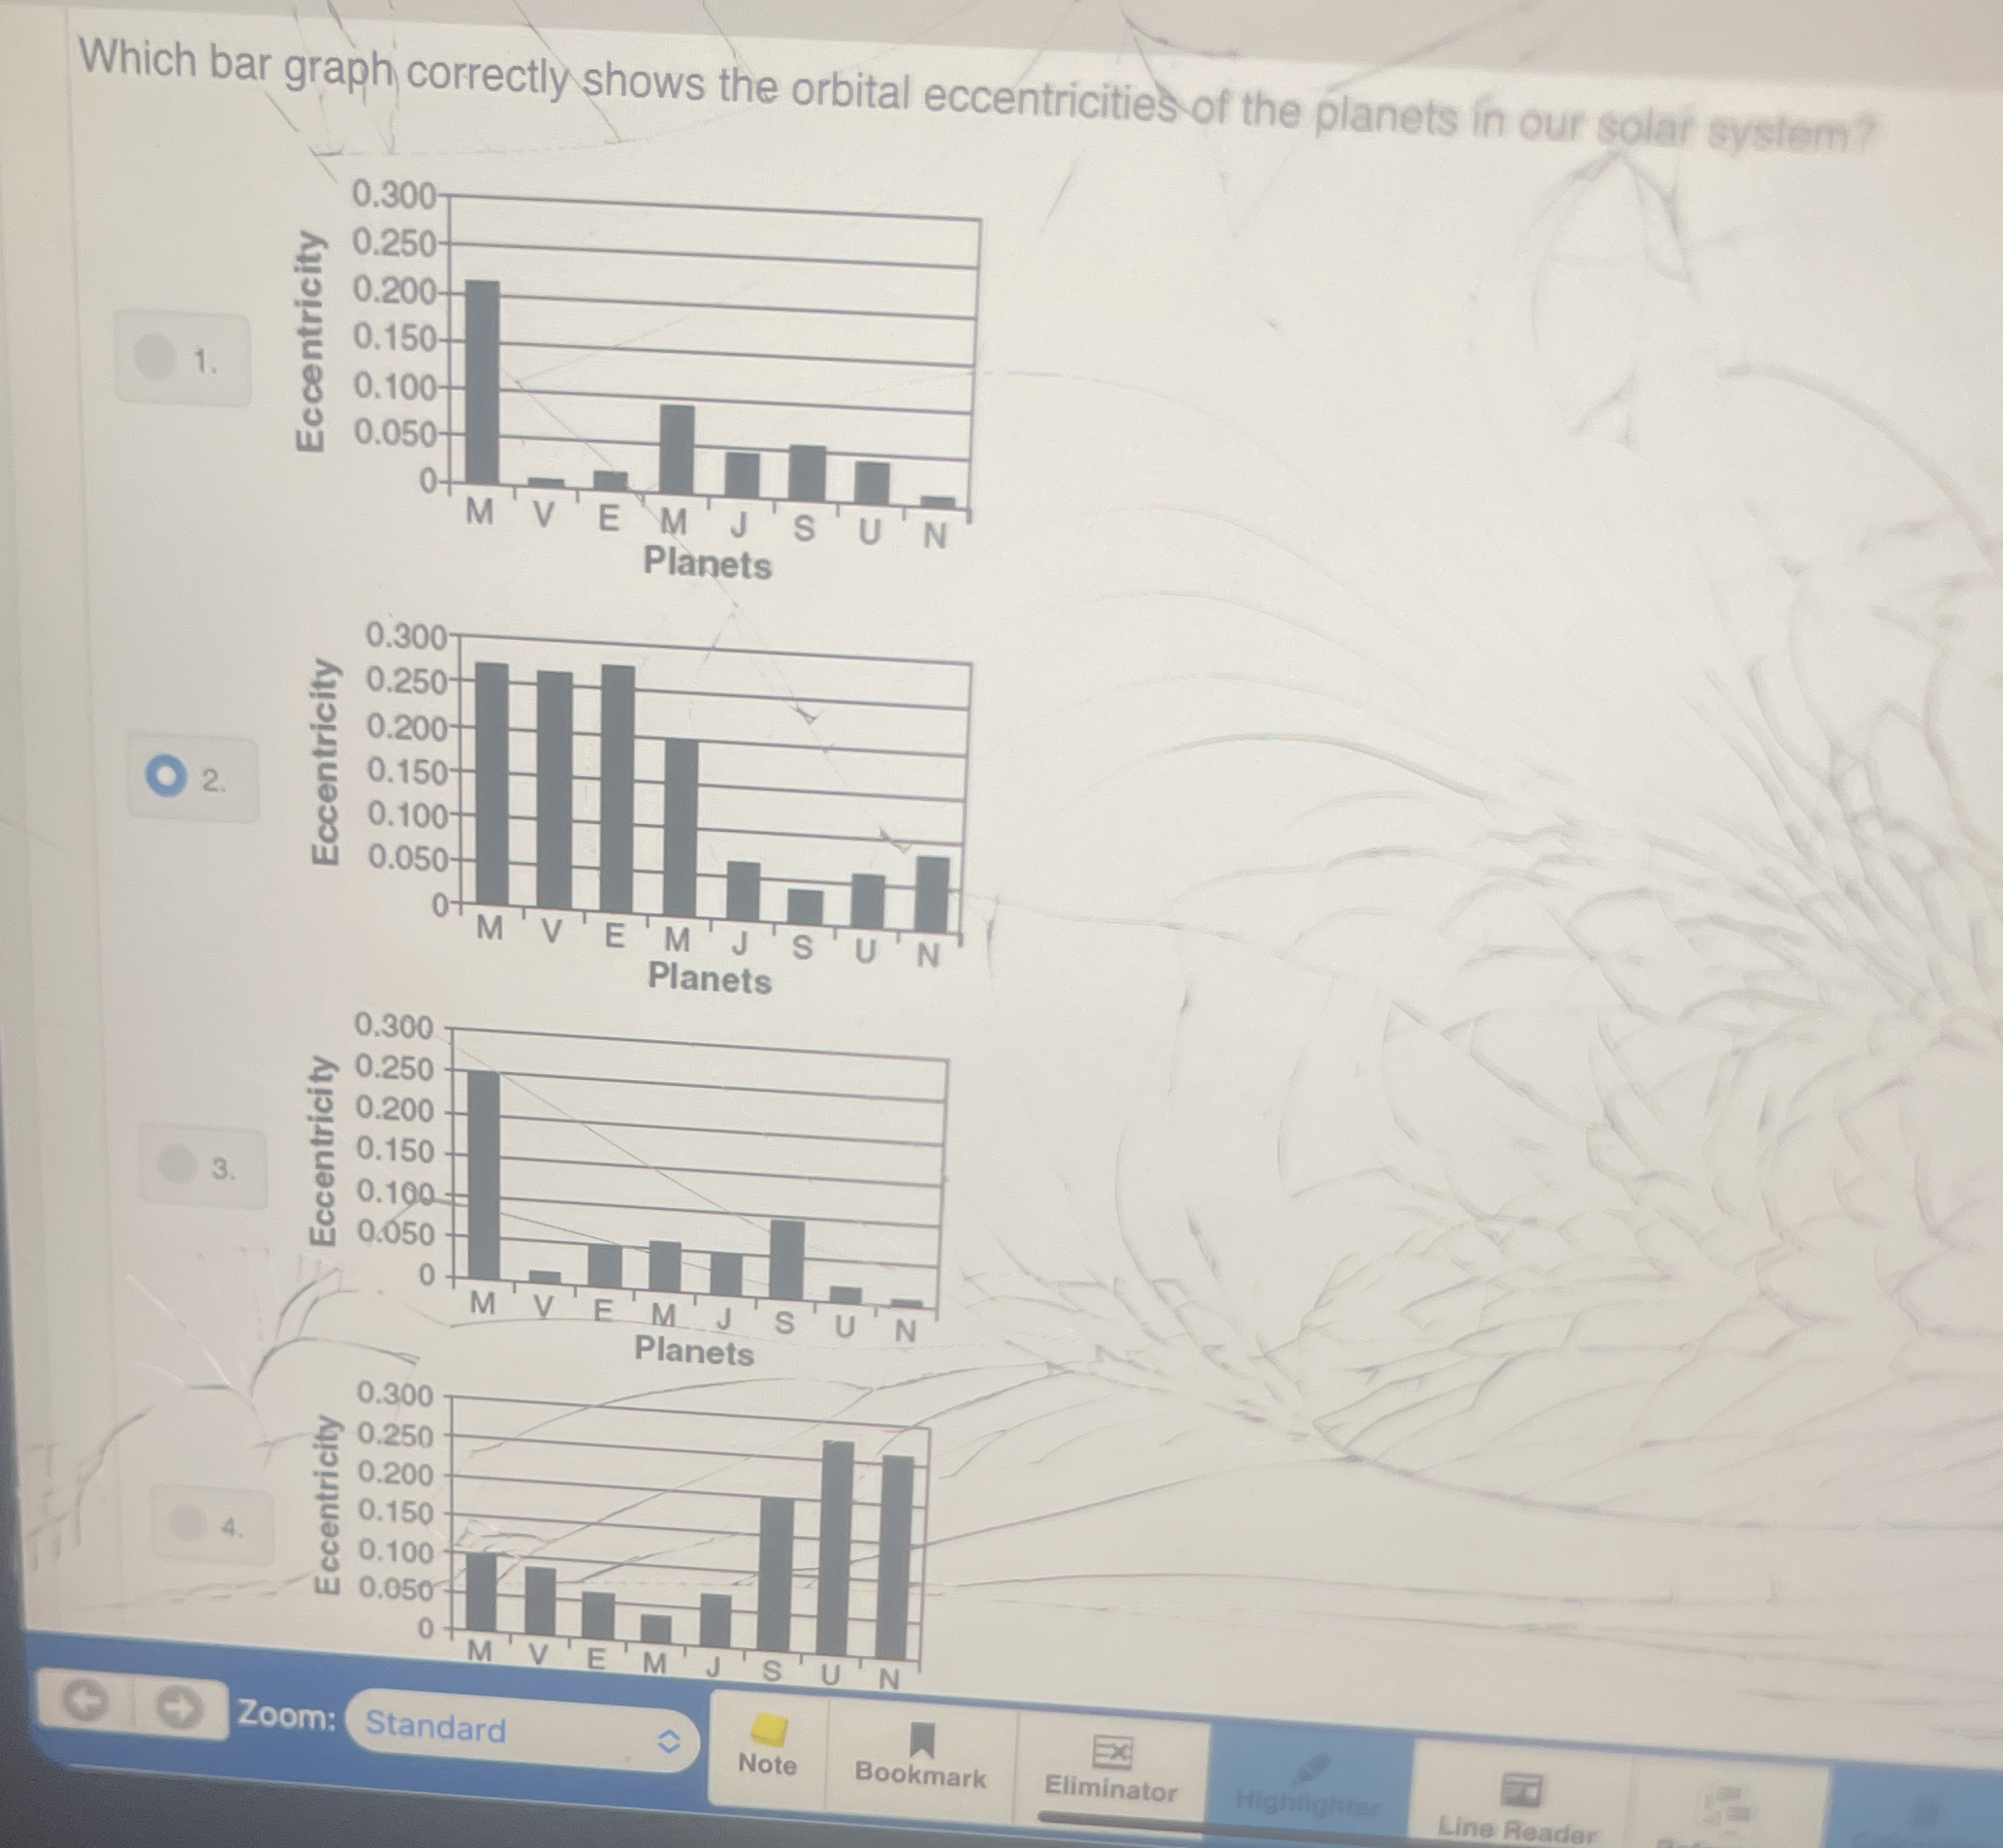
Which bar graph correctly shows the orbital eccentricities of the planets in our solar system?

Understand the Problem
The question is asking which of the provided bar graphs accurately represents the orbital eccentricities of the planets in our solar system. To solve this, we need to compare each graph against known data on the eccentricities of the planets.
Answer
Graph 3
The final answer is graph 3.
Answer for screen readers
The final answer is graph 3.
More Information
Graph 3 correctly represents the varying eccentricities of the planets. For example, Mercury has a high eccentricity compared to other planets, while Venus has a very low eccentricity.
Tips
Be sure to check the actual values of eccentricity for each planet when comparing with bar graphs.
Sources
AI-generated content may contain errors. Please verify critical information