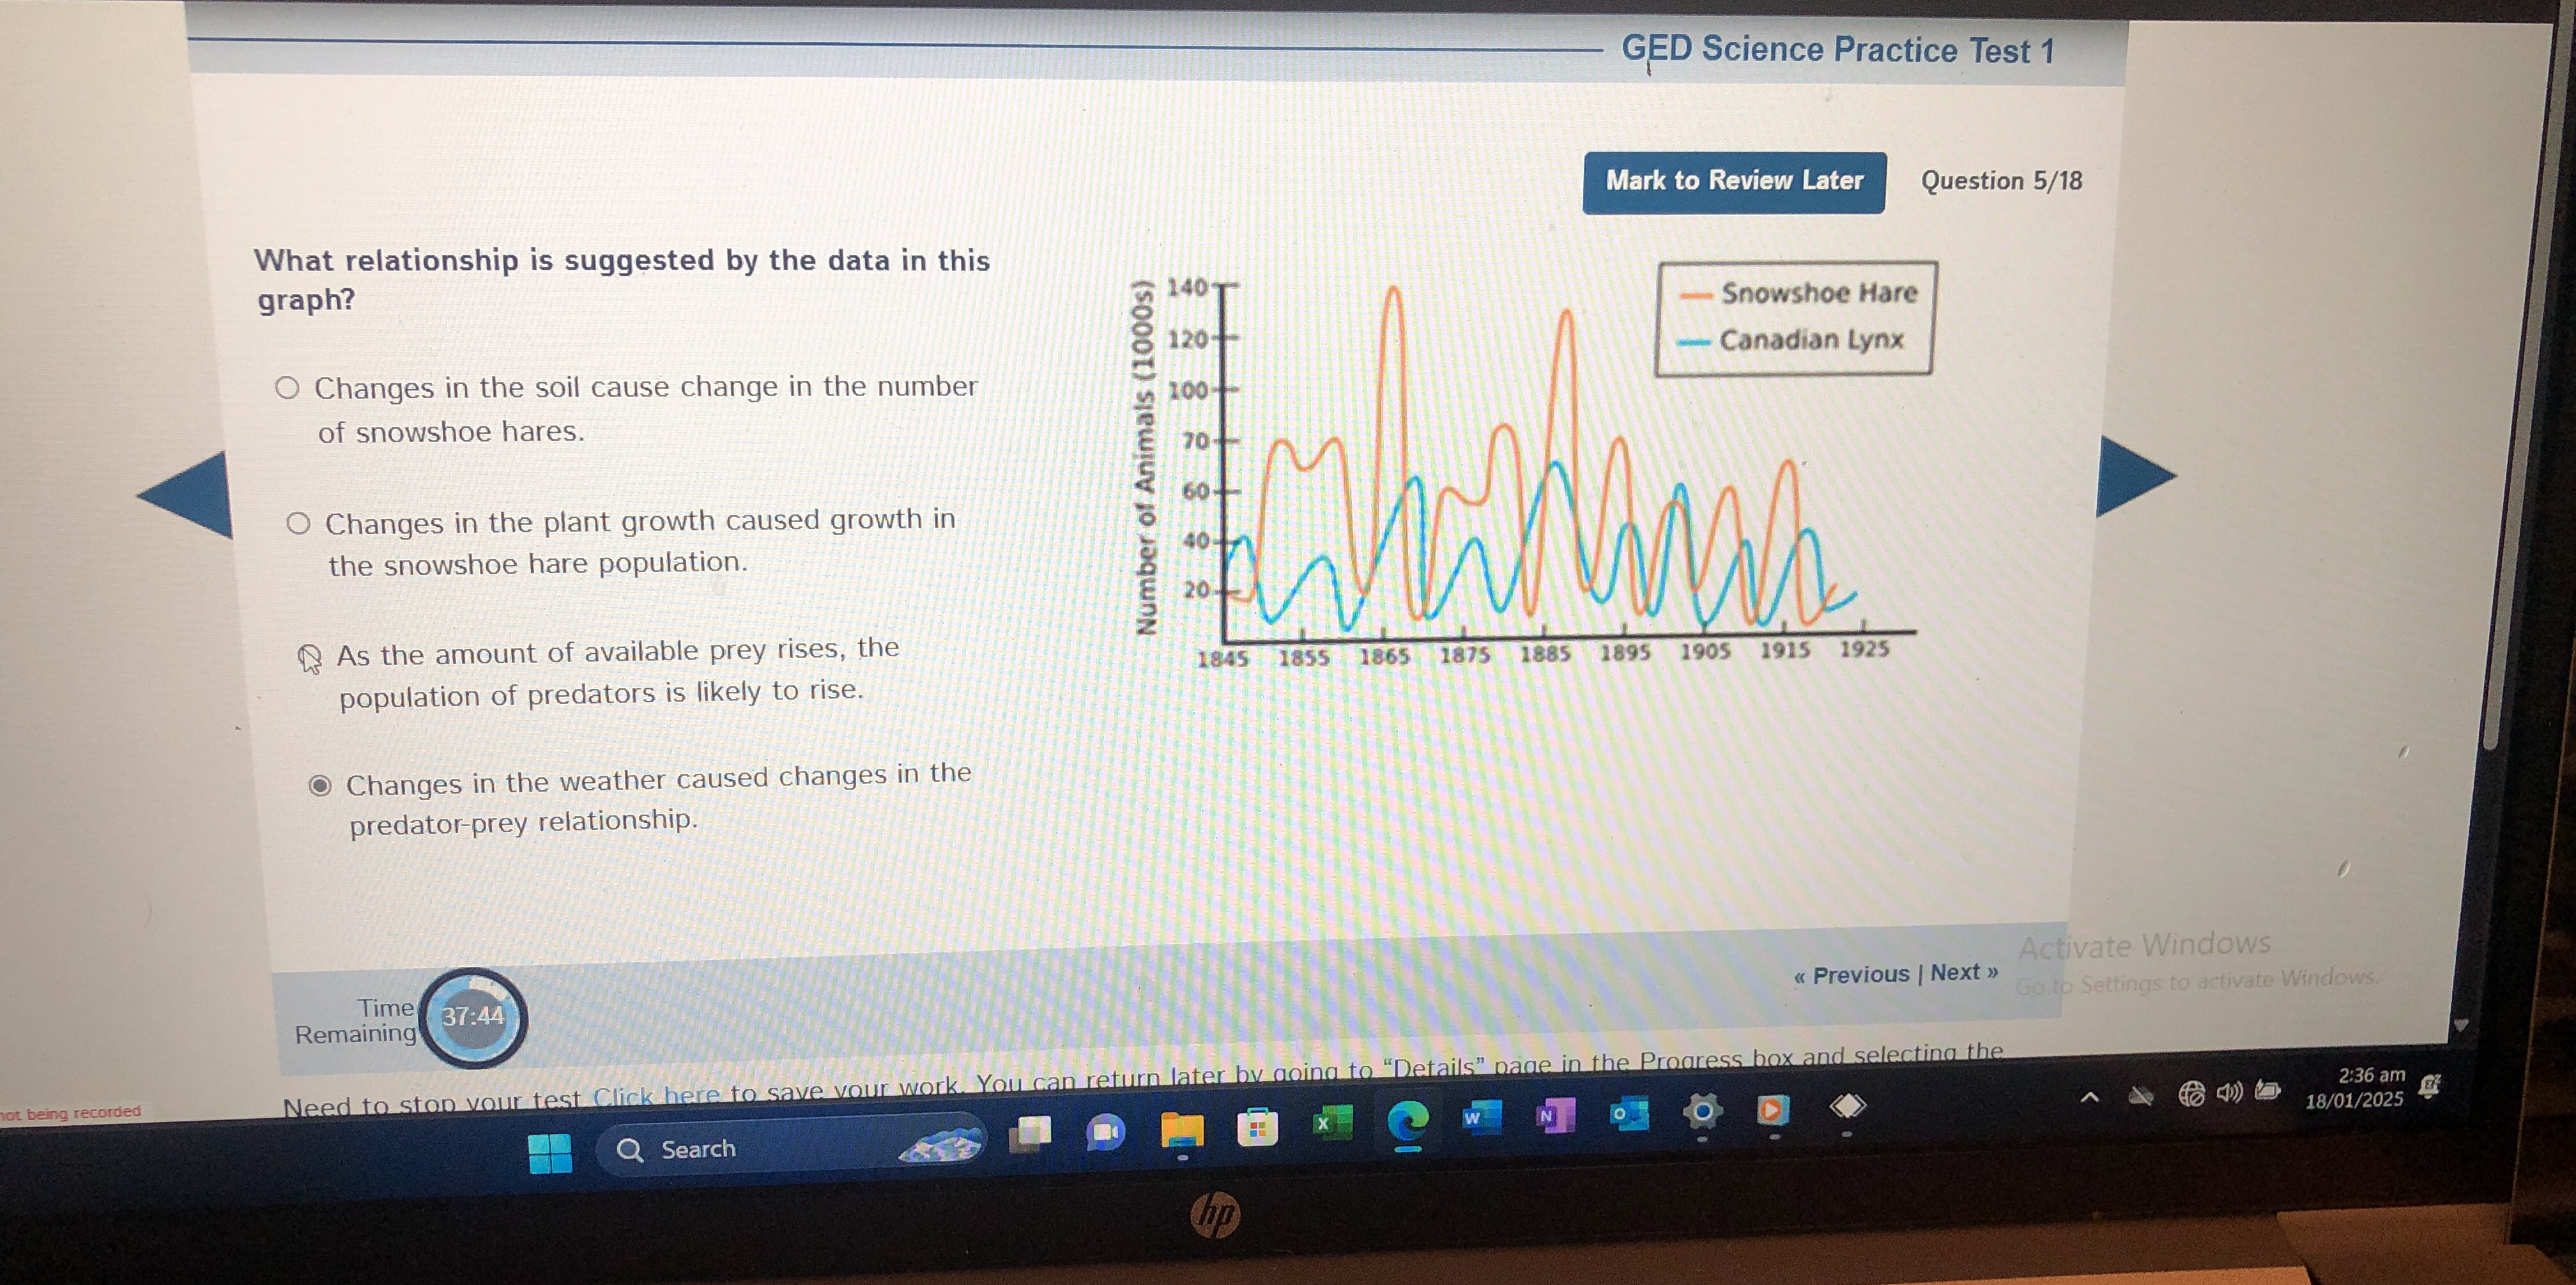
What relationship is suggested by the data in this graph?

Understand the Problem
The question is asking to interpret a graph that shows the relationship between snowshoe hares and Canadian lynx populations over time. It seeks to identify what ecological factors might influence predator-prey dynamics based on the depicted data.
Answer
As the amount of available prey rises, the population of predators is likely to rise.
The final answer is: As the amount of available prey rises, the population of predators is likely to rise.
Answer for screen readers
The final answer is: As the amount of available prey rises, the population of predators is likely to rise.
More Information
The graph suggests a predator-prey relationship between the snowshoe hare and the Canadian lynx, where the predator population follows the fluctuations in the prey population.
Tips
A common mistake is to overlook the cyclic nature of predator-prey graphs, where both populations rise and fall periodically.
Sources
AI-generated content may contain errors. Please verify critical information