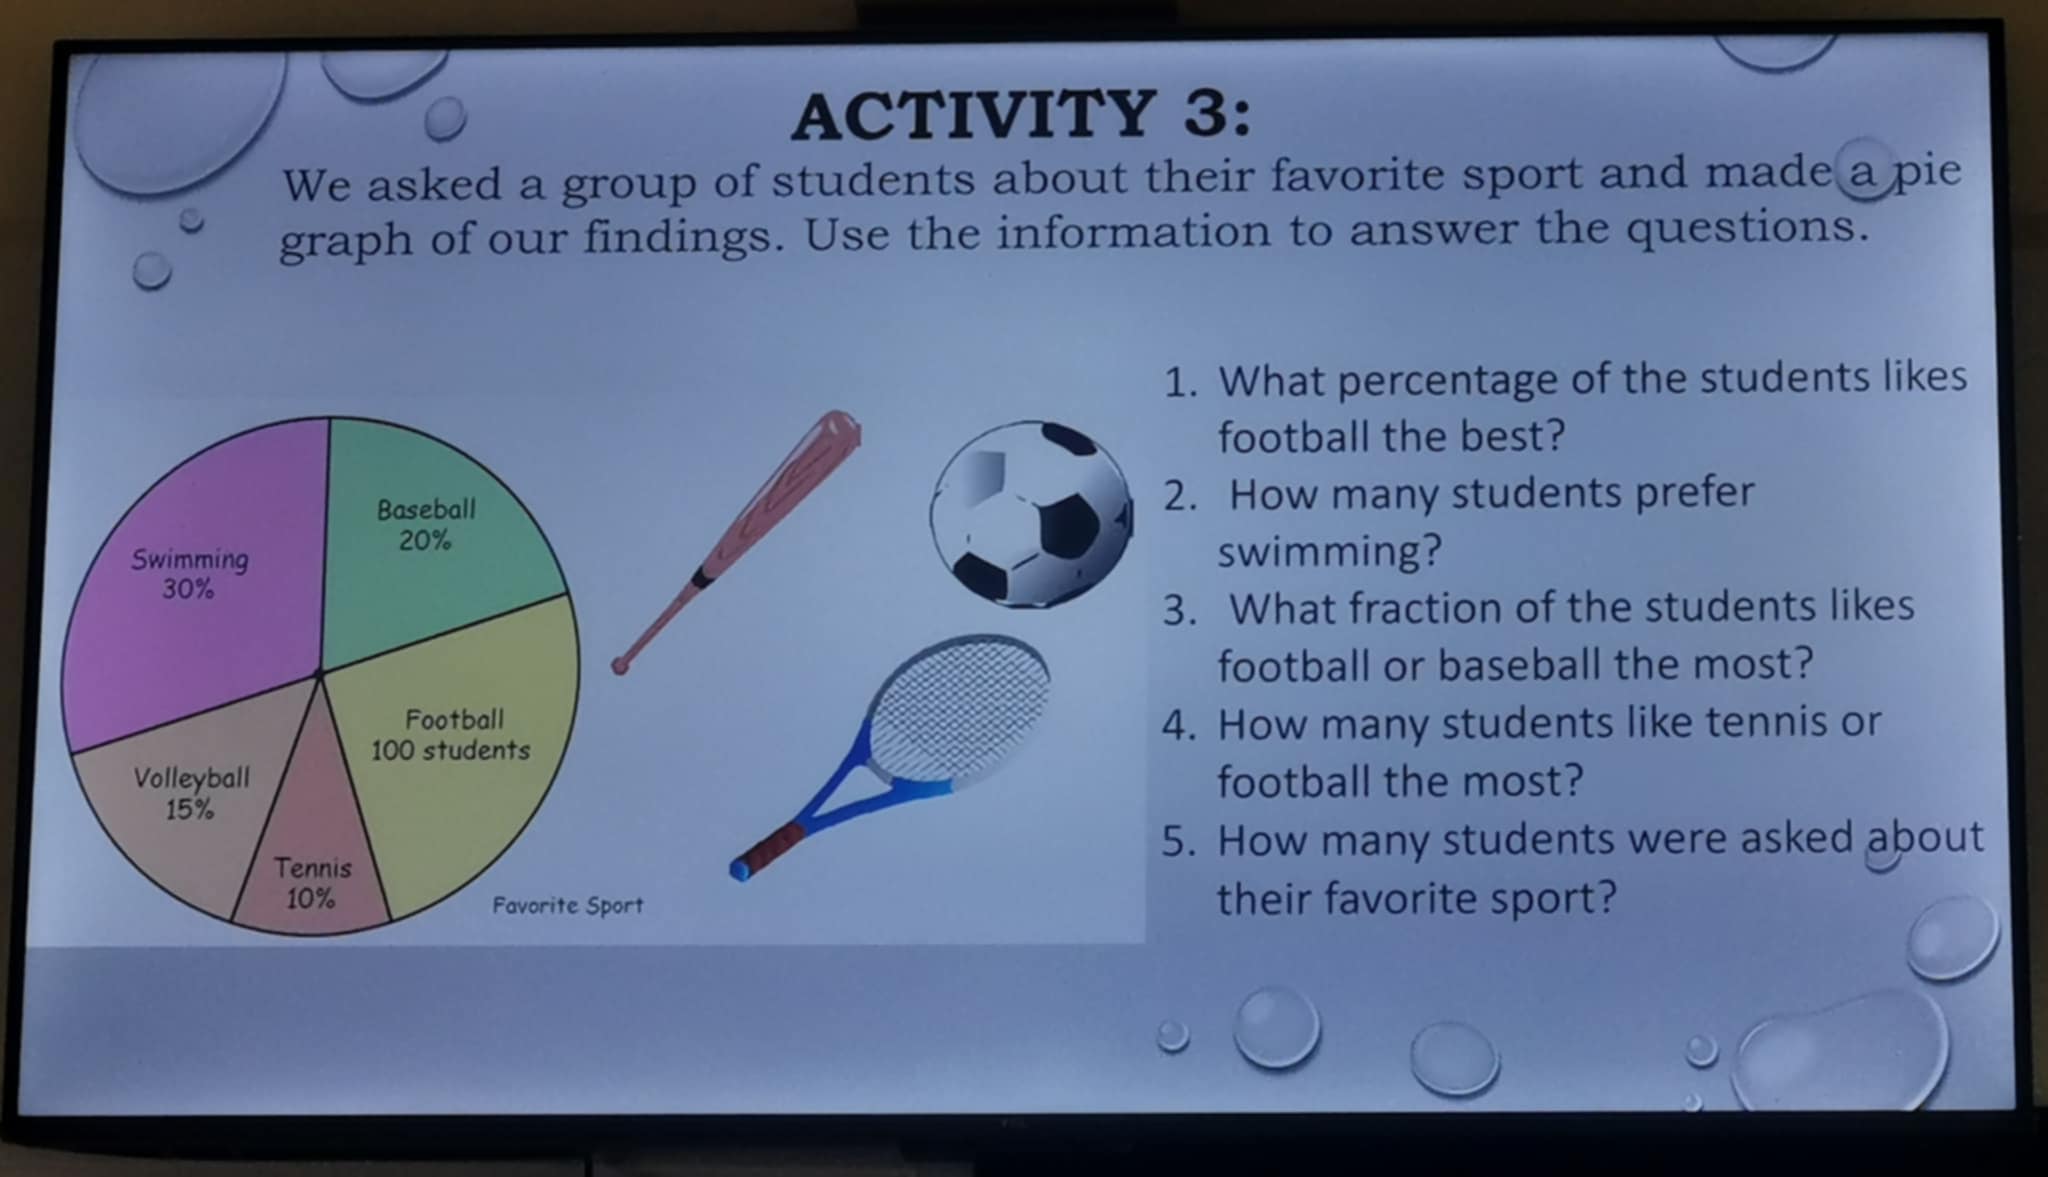
What percentage of the students likes football the best? How many students prefer swimming? What fraction of the students likes football or baseball the most? How many students lik... What percentage of the students likes football the best? How many students prefer swimming? What fraction of the students likes football or baseball the most? How many students like tennis or football the most? How many students were asked about their favorite sport?

Understand the Problem
The question involves interpreting a pie chart that displays students' preferences for different sports. The user needs to answer specific questions based on the data presented in the pie chart, such as percentages and counts of students who prefer certain sports.
Answer
1. Approximately 57.14% 2. 52 students 3. $\frac{135}{175}$ 4. 118 students 5. 175 students
Answer for screen readers
-
Approximately 57.14% of the students like football the best.
-
52 students prefer swimming.
-
The fraction of students liking football or baseball is $\frac{135}{175}$.
-
118 students like tennis or football the most.
-
The total number of students asked about their favorite sport is 175.
Steps to Solve
- Determine the total number of students asked The pie chart indicates that the preference for Football is represented as 100 students. To find the total number of students, note the percentages for each sport:
- Swimming: 30%
- Baseball: 20%
- Volleyball: 15%
- Tennis: 10%
- Football: This is already given as 100 students.
The percentages add up to: $$30 + 20 + 15 + 10 + 100 = 175$$
- Calculate the percentage who like football To find what percentage of students likes football:
- The total number of students is 175.
- The number of students who prefer football is 100.
Using the formula for percentage: $$ \text{Percentage} = \left( \frac{\text{Number of students liking football}}{\text{Total number of students}} \right) \times 100 $$ $$ \text{Percentage} = \left( \frac{100}{175} \right) \times 100 \approx 57.14% $$
-
Find how many students prefer swimming Since Swimming represents 30% of the total students (175): $$ \text{Students preferring swimming} = 30% \times 175 = \frac{30}{100} \times 175 = 52.5 \text{ (round to 52)} $$
-
Calculate the fraction of students who like football or baseball Football prefers 100 students and Baseball prefers 20% of 175: $$ \text{Students preferring baseball} = 20% \times 175 = \frac{20}{100} \times 175 = 35 $$
Total for Football and Baseball: $$ 100 + 35 = 135 $$
Fraction of students liking either: $$ \text{Fraction} = \frac{135}{175} $$
- Find how many students like tennis or football
- Tennis prefers 10% of 175: $$ \text{Students preferring tennis} = 10% \times 175 = \frac{10}{100} \times 175 = 17.5 \text{ (round to 18)} $$
Total for Tennis and Football: $$ 100 + 18 = 118 $$
- Total number of students surveyed The total number is already calculated as 175.
-
Approximately 57.14% of the students like football the best.
-
52 students prefer swimming.
-
The fraction of students liking football or baseball is $\frac{135}{175}$.
-
118 students like tennis or football the most.
-
The total number of students asked about their favorite sport is 175.
More Information
The pie chart visually displays the percentage preferences of students for various sports, providing a straightforward way to interpret numerical data in the context of overall counts.
Tips
- Misunderstanding percentages and assuming they directly translate to actual counts without calculating the total first.
- Rounding improperly; ensure students' counts are approximated logically in context.
AI-generated content may contain errors. Please verify critical information