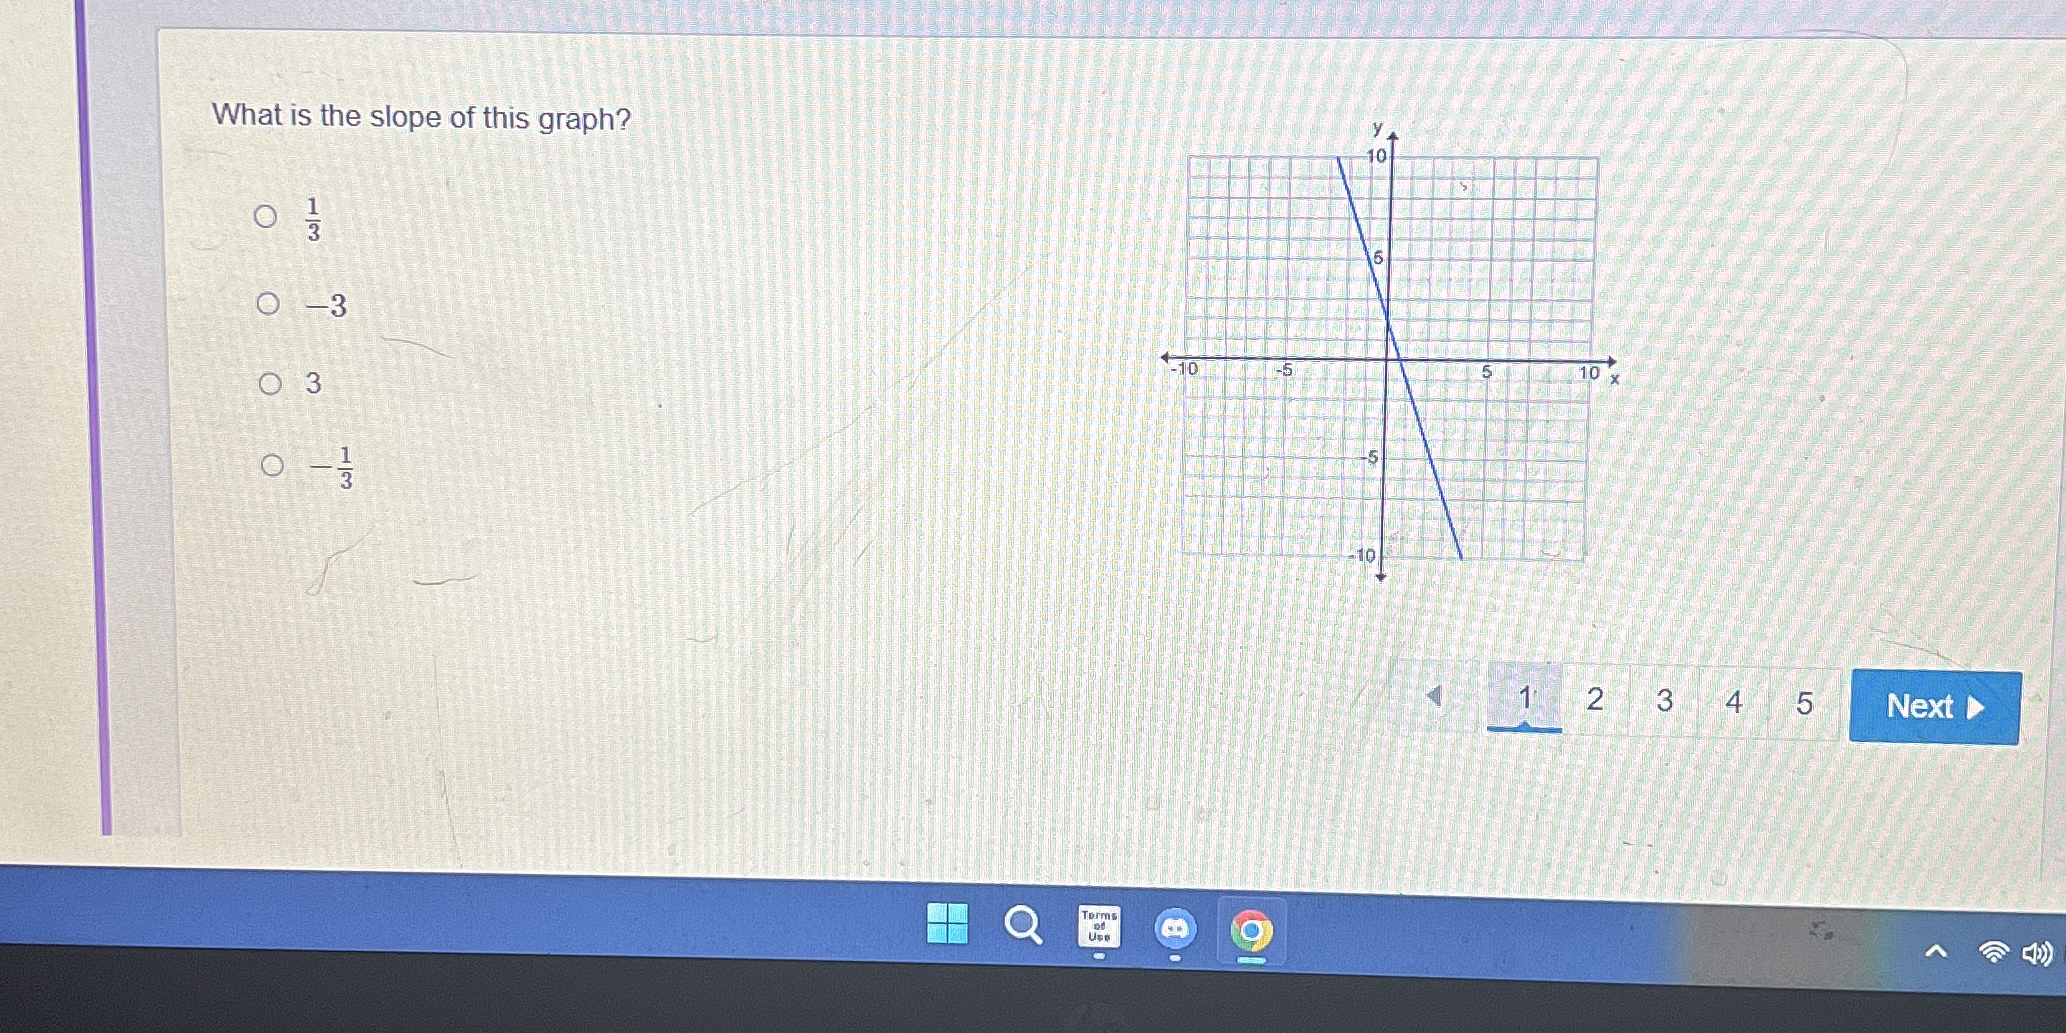
What is the slope of this graph?

Understand the Problem
The question is asking for the slope of a given graph. To find the slope, one would typically look at the rise over run between two points on the line represented in the graph.
Answer
The slope is $-1$.
Answer for screen readers
The slope of the graph is $-1$.
Steps to Solve
-
Identify two points on the line To find the slope, we need two points on the line. From the graph, let's identify the points where the line intersects grid lines clearly. For instance, the points might be (0, 2) and (3, -1).
-
Calculate the rise between the points The rise is the difference in the y-coordinates of the two points. If we use the points (0, 2) and (3, -1): The rise is calculated as: $$ \text{rise} = y_2 - y_1 = -1 - 2 = -3 $$
-
Calculate the run between the points The run is the difference in the x-coordinates of the two points. For the same points: The run is calculated as: $$ \text{run} = x_2 - x_1 = 3 - 0 = 3 $$
-
Calculate the slope The slope ($m$) is determined by dividing the rise by the run: $$ m = \frac{\text{rise}}{\text{run}} = \frac{-3}{3} = -1 $$
The slope of the graph is $-1$.
More Information
The slope of a line represents the steepness and direction of the line. A negative slope indicates that the line descends from left to right. In this case, the slope of $-1$ indicates that for every 1 unit increase in $x$, the value of $y$ decreases by 1 unit.
Tips
- Assuming the slope is positive when the line is descending.
- Confusing the x-coordinates and y-coordinates when calculating the rise and run.
AI-generated content may contain errors. Please verify critical information