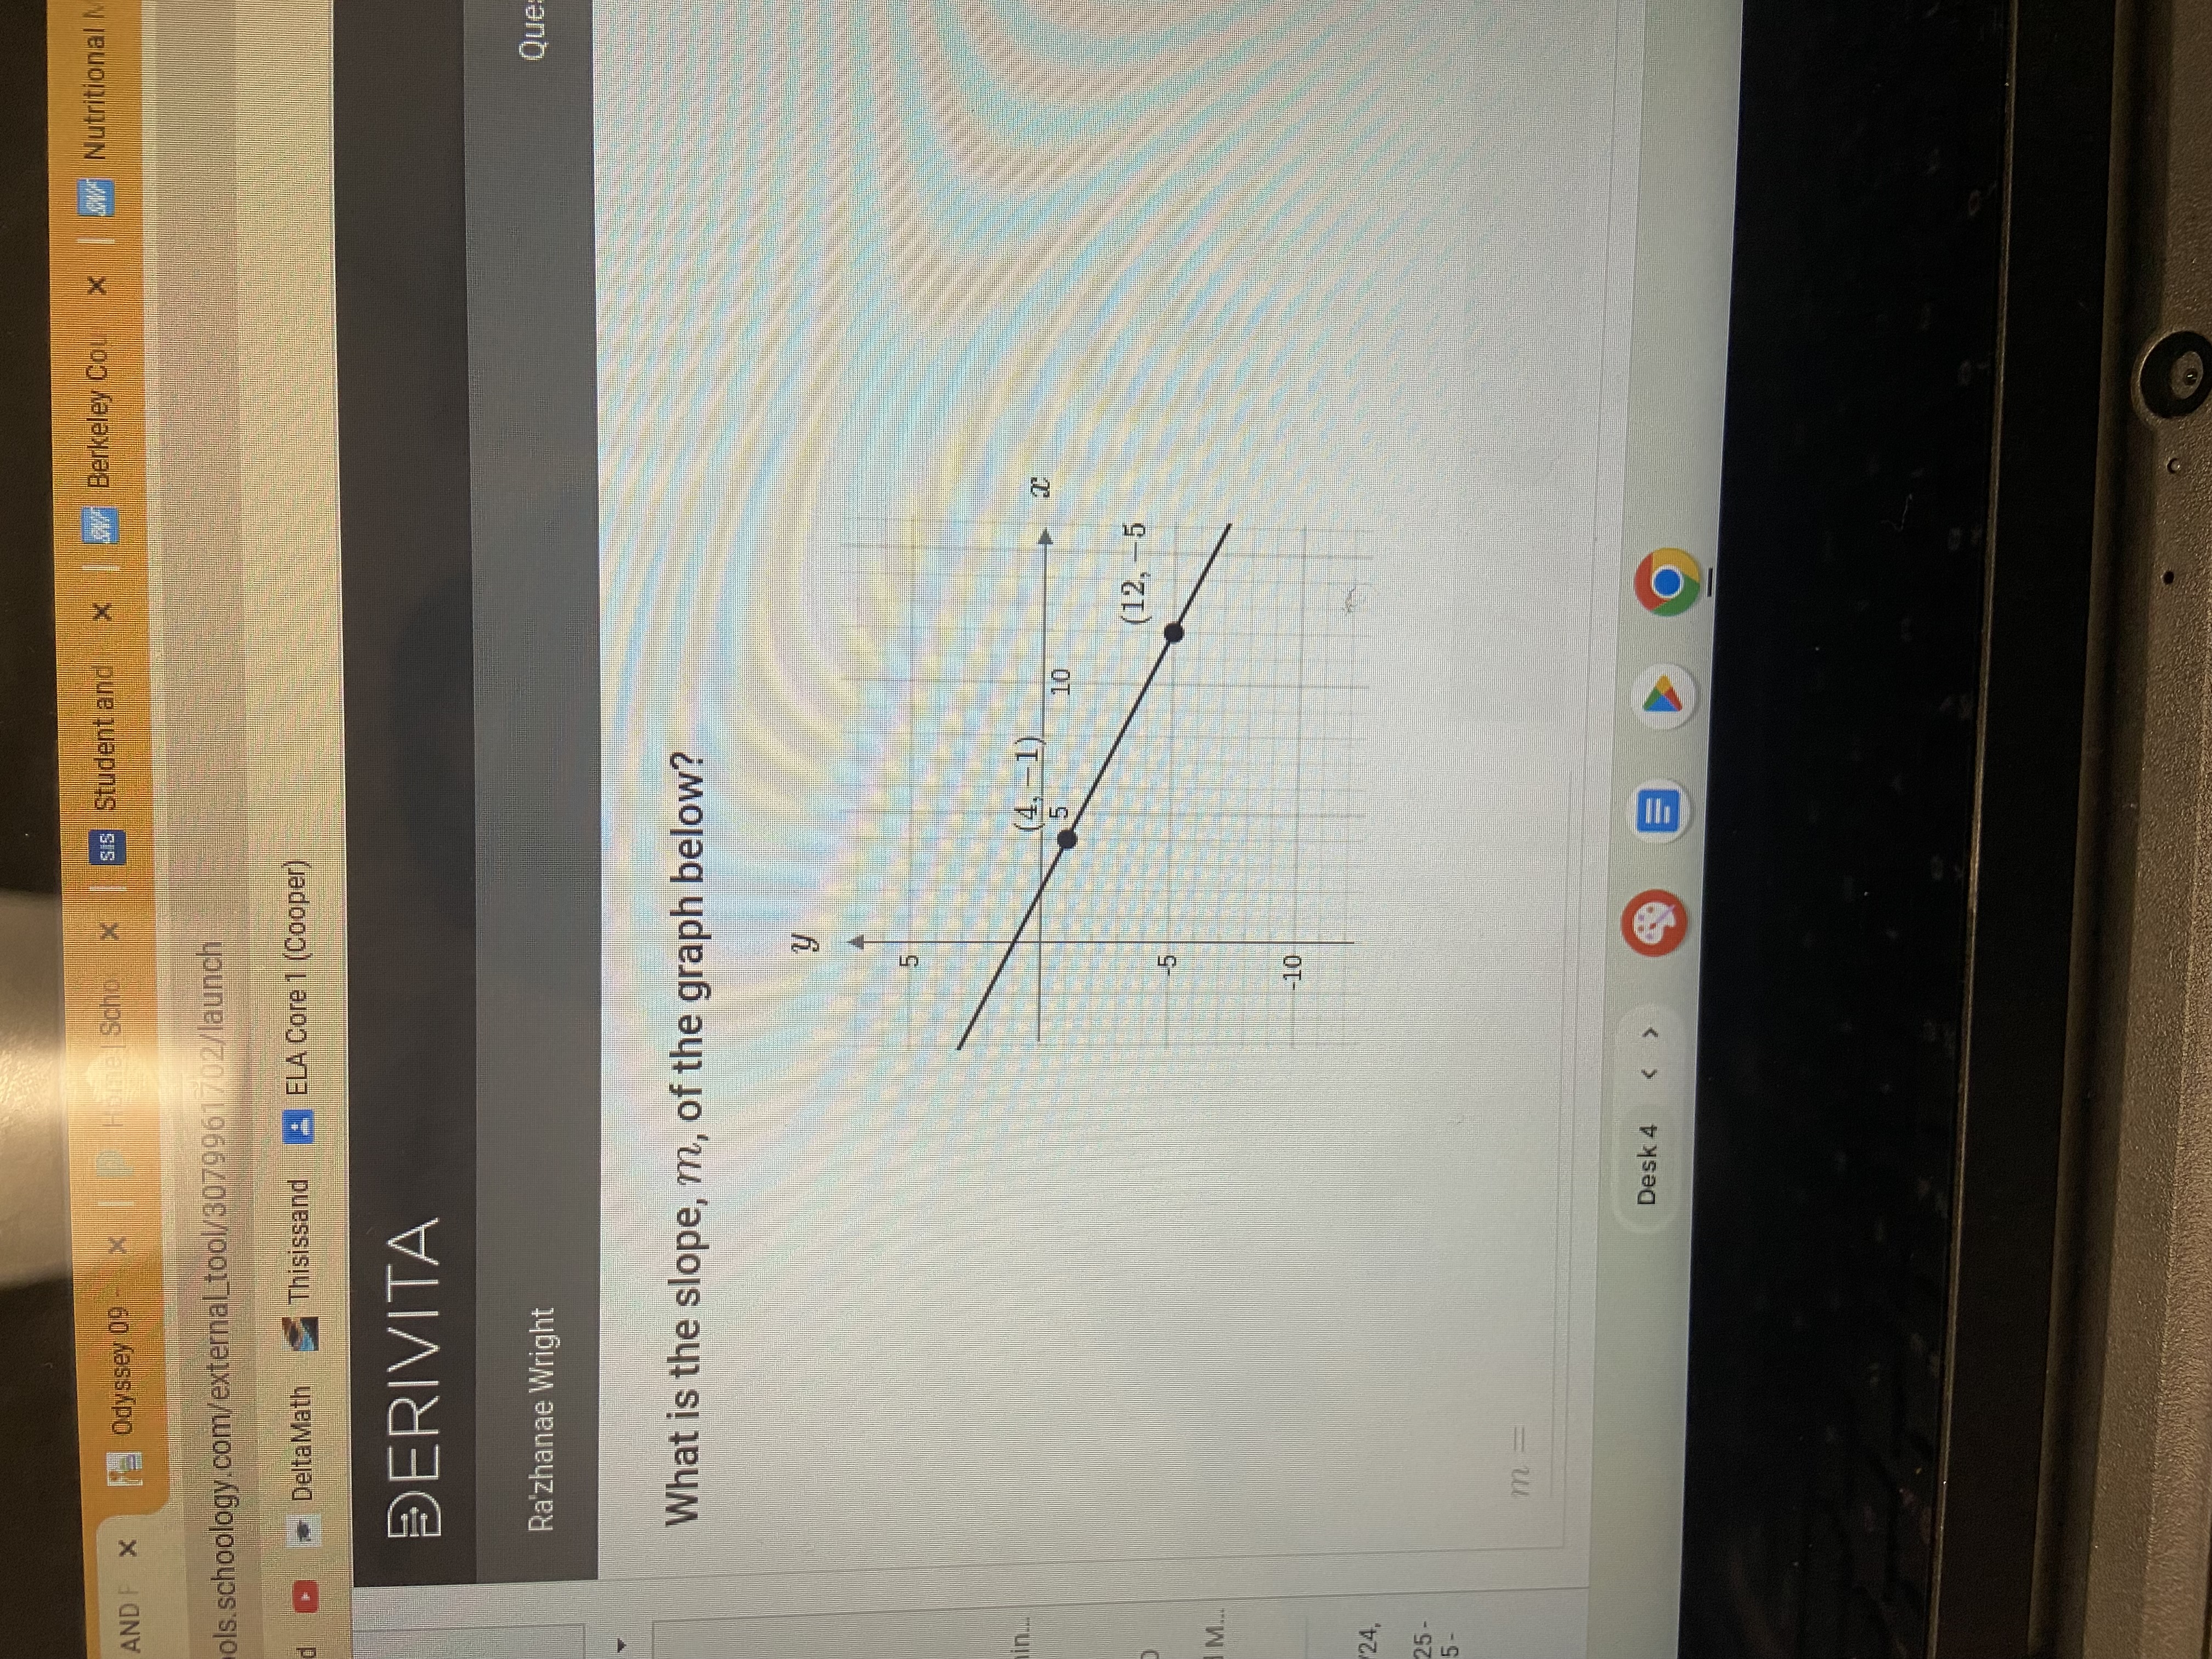
What is the slope, m, of the graph below?

Understand the Problem
The question is asking for the slope (m) of a given graph with two points marked on it. To find the slope, we generally calculate the change in y divided by the change in x between the two points.
Answer
The slope of the graph is $-0.5$.
Answer for screen readers
The slope, $m$, of the graph is $-0.5$.
Steps to Solve
-
Identify the Points The two points on the graph are $(4, -1)$ and $(12, -5)$.
-
Calculate the Change in y (Δy) Subtract the y-coordinates: $$ \Delta y = y_2 - y_1 = -5 - (-1) = -5 + 1 = -4 $$
-
Calculate the Change in x (Δx) Subtract the x-coordinates: $$ \Delta x = x_2 - x_1 = 12 - 4 = 8 $$
-
Calculate the Slope (m) Use the slope formula: $$ m = \frac{\Delta y}{\Delta x} = \frac{-4}{8} = -0.5 $$
The slope, $m$, of the graph is $-0.5$.
More Information
The slope of a line indicates its steepness and direction. A negative slope means the line goes downward from left to right. In this case, for every unit increase in $x$, the value of $y$ decreases by $0.5$.
Tips
- Forgetting to subtract the y-coordinates correctly, leading to incorrect changes.
- Mixing up the coordinates, which could change the order of subtraction and lead to an incorrect slope value.
AI-generated content may contain errors. Please verify critical information