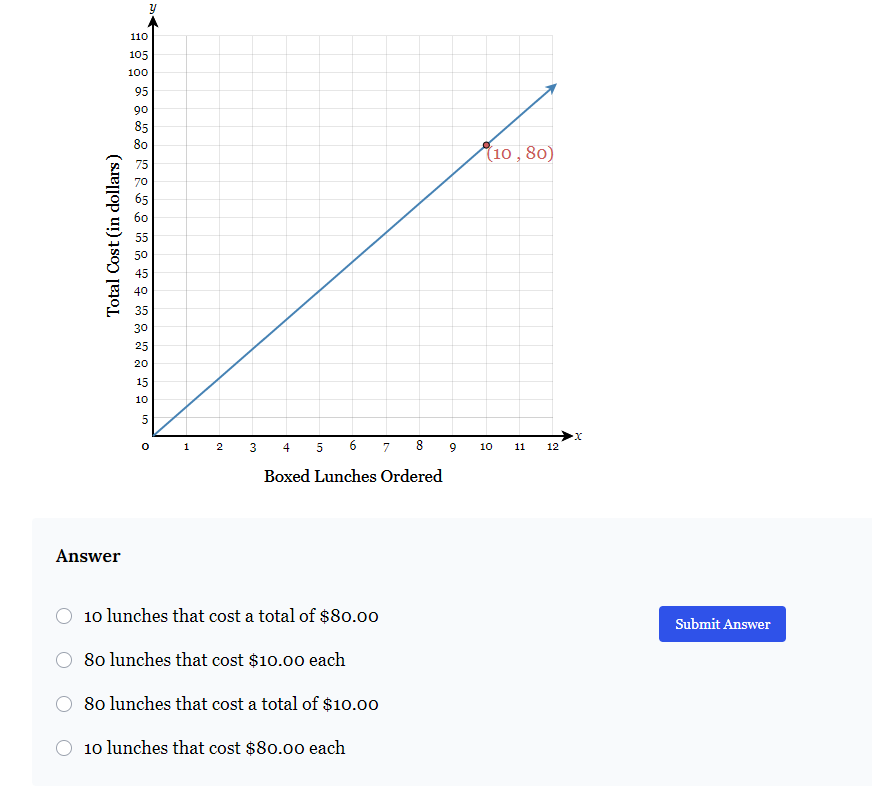
What does the point (10, 80) on the graph represent in terms of boxed lunches?

Understand the Problem
The question is asking us to interpret a graph in order to identify the cost per boxed lunch based on the total costs displayed. We need to analyze the data represented on the graph at the point (10, 80), which indicates that ordering 10 lunches results in a total expense of $80. This will help determine the correct answer from the provided options.
Answer
10 lunches that cost a total of $80.00
Answer for screen readers
10 lunches that cost a total of $80.00
Steps to Solve
-
Identify the Total Cost From the graph, at the point (10, 80), the total cost for ordering 10 boxed lunches is $80.
-
Calculate the Cost per Boxed Lunch To find the cost per boxed lunch, divide the total cost by the number of lunches. [ \text{Cost per lunch} = \frac{\text{Total Cost}}{\text{Number of Lunches}} = \frac{80}{10} = 8 ] This means each boxed lunch costs $8.
-
Select the Correct Answer Now, review the provided options:
- 10 lunches that cost a total of $80.00 (which is true)
- 80 lunches that cost $10.00 each (not true)
- 80 lunches that cost a total of $10.00 (not true)
- 10 lunches that cost $80.00 each (not true)
The correct interpretation corresponds to the first option.
10 lunches that cost a total of $80.00
More Information
The total cost of $80 for 10 lunches means that each lunch costs $8. This is an important step in interpreting data from graphs, as it helps establish individual costs from total values.
Tips
- Confusing total cost with individual cost. It’s important to always calculate the cost per item rather than assuming it directly from the total.
- Overlooking the number of items when analyzing the total cost.
AI-generated content may contain errors. Please verify critical information