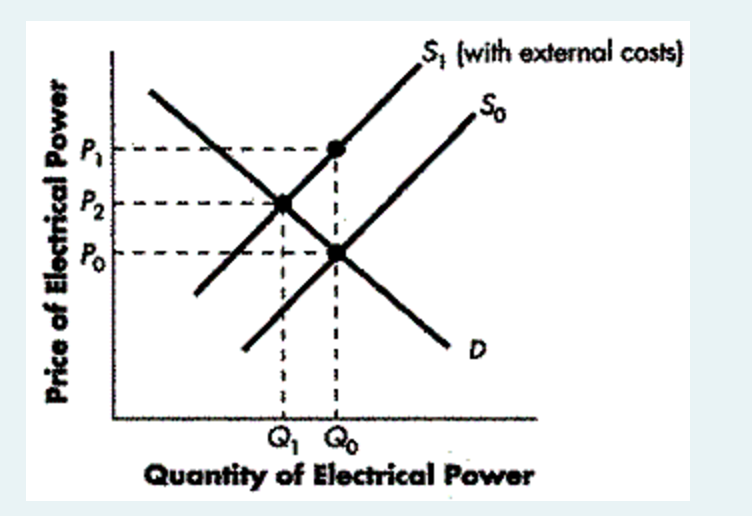
What does the graph representing the supply and demand for electrical power illustrate, particularly in relation to external costs?
Understand the Problem
The question is likely asking for an analysis of the graph depicting the supply and demand of electrical power, particularly focusing on the impact of external costs on the supply curve.
Answer
External costs raise prices and reduce quantity in electricity supply.
The graph illustrates the impact of external costs on the supply of electrical power. Including external costs shifts the supply curve leftward, leading to a higher price and a lower quantity of electricity produced.
Answer for screen readers
The graph illustrates the impact of external costs on the supply of electrical power. Including external costs shifts the supply curve leftward, leading to a higher price and a lower quantity of electricity produced.
More Information
External costs, such as pollution from electricity production, increase production costs, leading to a higher market price and reduced quantity.
Tips
A common mistake is to overlook the reason the supply curve shifts leftward due to external costs, leading to misunderstanding the impact on price and quantity.
Sources
- Solved Figure 16.3 depicts a market for electricity. S1 is | Chegg.com - chegg.com
- 5.1 Externalities – Principles of Microeconomics - pressbooks.bccampus.ca
AI-generated content may contain errors. Please verify critical information