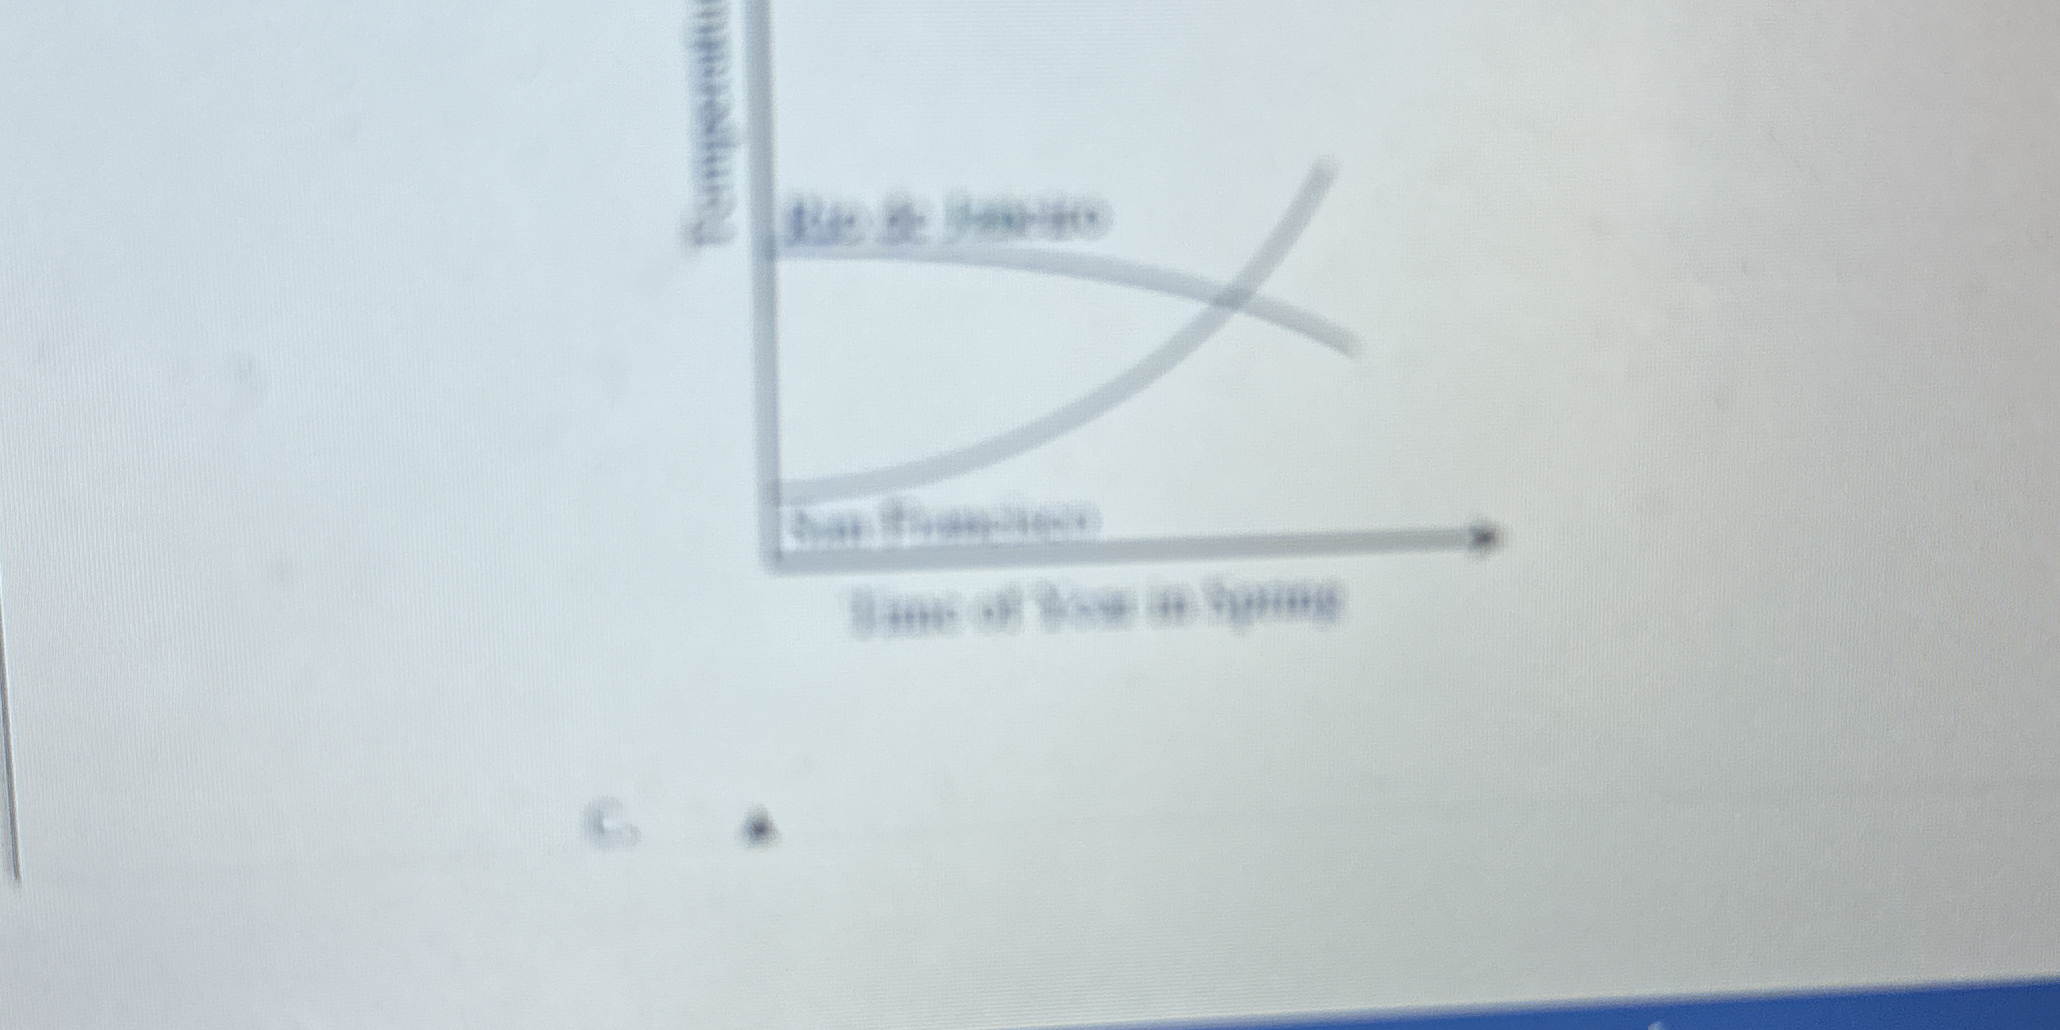
What does the graph illustrate about precipitation in Rio de Janeiro compared to San Francisco during the spring season?

Understand the Problem
The question is about a graph comparing two locations, Rio de Janeiro and San Francisco, over the time of year in spring, specifically relating to precipitation. The user likely seeks to understand the relationship or differences shown in the graph.
Answer
Precipitation decreases in Rio and increases in San Francisco during spring.
The graph illustrates that precipitation decreases in Rio de Janeiro and increases in San Francisco during spring.
Answer for screen readers
The graph illustrates that precipitation decreases in Rio de Janeiro and increases in San Francisco during spring.
More Information
This pattern is typical due to different climatic influences: Rio de Janeiro experiences less rainfall as it moves out of the wet season, while San Francisco receives more precipitation in the form of spring rains.
Tips
Ensure to note both the direction and magnitude of the trends for accurate interpretation.
AI-generated content may contain errors. Please verify critical information