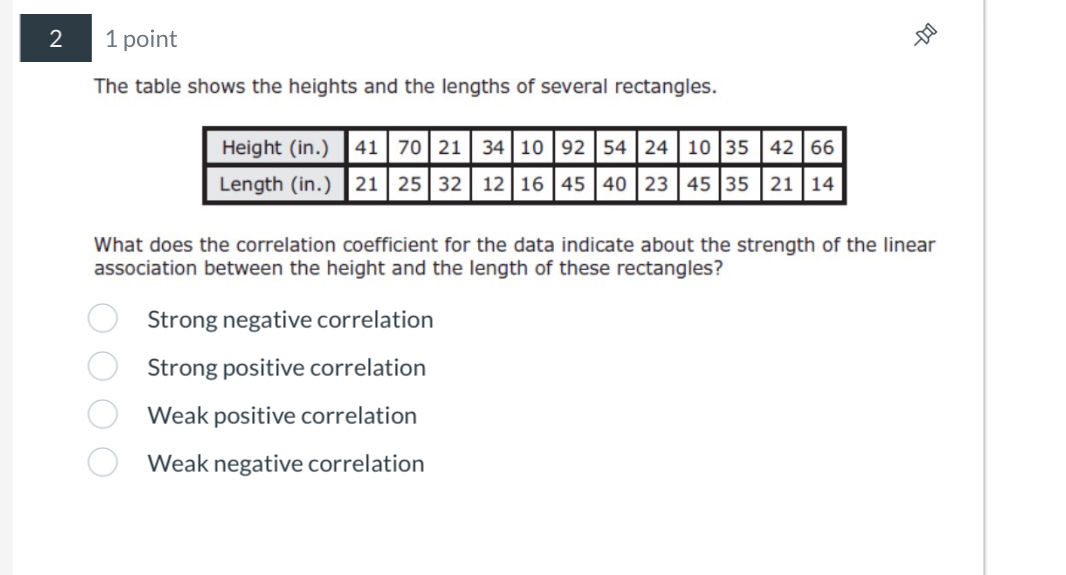
What does the correlation coefficient for the data indicate about the strength of the linear association between the height and the length of these rectangles?

Understand the Problem
The question is asking what the correlation coefficient indicates regarding the relationship between the height and length of rectangles, using a provided data table. Specifically, it seeks to determine the strength and direction of the linear association between the two sets of measurements.
Answer
Weak negative correlation.
Answer for screen readers
The correlation coefficient indicates a weak negative correlation.
Steps to Solve
-
Understand the Data
The data consists of two sets of values: Heights of rectangles and their corresponding Lengths. We will analyze the correlation between these two sets. -
Calculate the Correlation Coefficient
Use the formula for the correlation coefficient $r$: $$ r = \frac{n(\sum xy) - (\sum x)(\sum y)}{\sqrt{[n\sum x^2 - (\sum x)^2][n\sum y^2 - (\sum y)^2]}} $$
Here, $x$ represents heights, $y$ represents lengths, and $n$ is the number of pairs. -
Collect Necessary Values
For calculations, compute the following:- $n = 10$ (number of pairs)
- $\sum x$ (sum of heights)
- $\sum y$ (sum of lengths)
- $\sum xy$ (sum of products of heights and lengths)
- $\sum x^2$ (sum of squared heights)
- $\sum y^2$ (sum of squared lengths)
-
Substitute Values
Substitute the computed values into the formula to calculate $r$. -
Interpret the Correlation Coefficient
Based on the result of $r$:- If $r \approx 1$, there is a strong positive correlation.
- If $r \approx -1$, there is a strong negative correlation.
- If $r \approx 0$, there’s little to no correlation.
- Values close to 1 or -1 indicate strong correlations.
-
Select the Correct Answer
Determine which option (strong negative, strong positive, weak positive, weak negative correlation) best describes the calculated $r$.
The correlation coefficient indicates a weak negative correlation.
More Information
The correlation coefficient summarizes the direction and strength of a linear relationship between two datasets. A value closer to -1 suggests a weak negative correlation, while values closer to 1 indicate a strong positive correlation.
Tips
- Confusing correlation with causation: Correlation does not imply that changes in height cause changes in length.
- Misinterpreting the strength of the correlation based on its value: Remember that nearly identical values can suggest similar strengths in correlation.
AI-generated content may contain errors. Please verify critical information