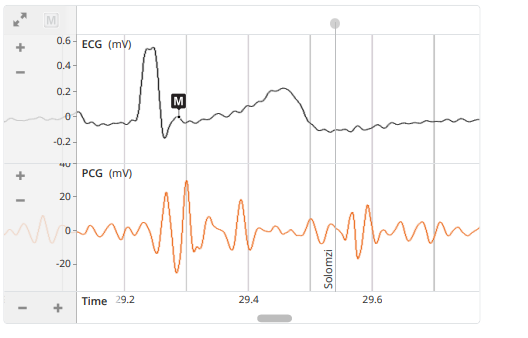
What do the ECG and PCG waveforms in the image represent?

Understand the Problem
The question is asking about the content and significance of the ECG and PCG waveforms displayed in the image, likely related to a physiological or medical context.
Answer
ECG: Electrical heart activity; PCG: Mechanical heart activity (sounds).
The ECG waveform represents the electrical activity of the heart, typically showing the P wave, QRS complex, and T wave. The PCG waveform represents the mechanical activity, capturing heart sounds associated with valve closures (e.g., S1, S2).
Answer for screen readers
The ECG waveform represents the electrical activity of the heart, typically showing the P wave, QRS complex, and T wave. The PCG waveform represents the mechanical activity, capturing heart sounds associated with valve closures (e.g., S1, S2).
More Information
ECG provides crucial information about the heart's electrical condition and is used to diagnose a variety of cardiac issues. PCG is used to listen to and analyze heart sounds, which can indicate abnormal valve function.
Tips
Confusing mechanical and electrical signals is common. It's important to recognize ECG for electrical activity and PCG for mechanical sounds.
Sources
- Heart detection and diagnosis based on ECG and EPCG relationships - ncbi.nlm.nih.gov
- Phonocardiography - an overview | ScienceDirect Topics - sciencedirect.com
- Example of an ECG-labeled PCG - researchgate.net
AI-generated content may contain errors. Please verify critical information