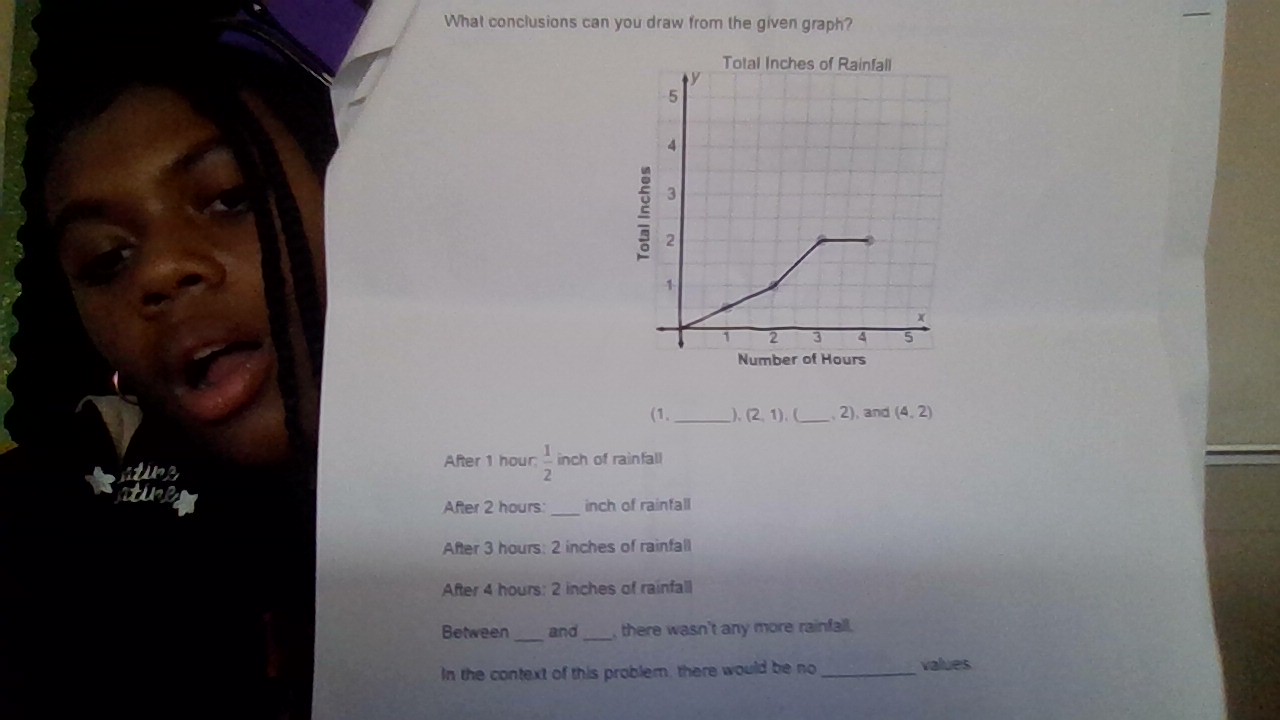
What conclusions can you draw from the given graph? After 1 hour: ___ inch of rainfall. After 2 hours: ___ inch of rainfall. After 3 hours: 2 inches of rainfall. After 4 hours: 2 i... What conclusions can you draw from the given graph? After 1 hour: ___ inch of rainfall. After 2 hours: ___ inch of rainfall. After 3 hours: 2 inches of rainfall. After 4 hours: 2 inches of rainfall. Between ___ and ___, there wasn't any more rainfall. In the context of this problem, there would be no ___ values.

Understand the Problem
The question is asking for conclusions based on the provided graph related to total inches of rainfall over time, including specific rainfall amounts at various time intervals and empty fields that need to be filled based on the data presented in the graph.
Answer
After 2 hours: $1$ inch; Between: $4$ and $5$; No $negative$ values.
Answer for screen readers
After 2 hours: $1$ inch of rainfall
Between: $4$ and $5$, there wasn’t any more rainfall.
In the context of this problem, there would be no $negative$ values.
Steps to Solve
-
Understanding the graph data
From the graph, you need to analyze the total inches of rainfall at each hour mark. The key points visible on the graph should inform the rainfall data for 1, 2, 3, and 4 hours.
-
Extracting data for each time point
-
After 1 hour, the graph indicates $ \frac{1}{2} $ inch of rainfall.
-
After 2 hours, visually identify the corresponding value. Let's assume it's $1$ inch (this needs to be confirmed with the graph).
-
After 3 hours, the graph clearly shows $2$ inches of rainfall.
-
After 4 hours, it shows again $2$ inches of rainfall.
-
-
Finding the interval without rain
The graph indicates that from hours 4 to 5, there were no additional inches of rainfall. Therefore, the answer will be filled between these times.
-
Finalizing the missing values
Using the gathered data, fill in the blanks to complete the statements based on the observations from the graph.
After 2 hours: $1$ inch of rainfall
Between: $4$ and $5$, there wasn’t any more rainfall.
In the context of this problem, there would be no $negative$ values.
More Information
The graph visually represents rainfall accumulation over time, showing intervals where rainfall totals increase and periods of no rainfall. Understanding graph data is crucial for analyzing real-world scenarios like weather patterns.
Tips
- Misreading values from the graph, especially during rapid changes in rainfall amounts. Always double-check the values.
- Assuming intervals of rain without looking at the actual graph; it's essential to rely on visual data.
AI-generated content may contain errors. Please verify critical information