What can be inferred from the graph of Real Gross Domestic Product from 2000 to 2022?

Understand the Problem
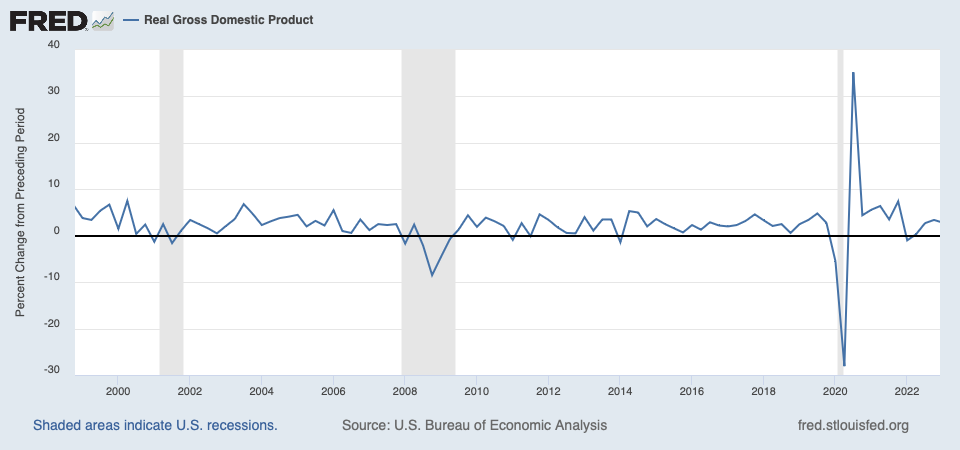
The question is likely related to analyzing the graph of Real Gross Domestic Product (GDP), which shows the percentage change from preceding periods over time. It looks at economic trends and the impact of recessions.
Answer
Fluctuations in GDP with drops during 2008 crisis and 2020 pandemic.
The graph shows fluctuations in real GDP from 2000 to 2022, with recessions indicated by shaded areas. Notable decreases in GDP appear during the 2008 financial crisis and the 2020 COVID-19 pandemic, followed by sharp recoveries.
Answer for screen readers
The graph shows fluctuations in real GDP from 2000 to 2022, with recessions indicated by shaded areas. Notable decreases in GDP appear during the 2008 financial crisis and the 2020 COVID-19 pandemic, followed by sharp recoveries.
More Information
The graph highlights the impacts of major economic events like the 2008 financial crisis and the COVID-19 pandemic on U.S. economic growth.
Tips
Avoid assuming linear growth; economic data can be affected by sudden events.
Sources
- Real Gross Domestic Product (GDPC1) | FRED | St. Louis Fed - fred.stlouisfed.org
AI-generated content may contain errors. Please verify critical information