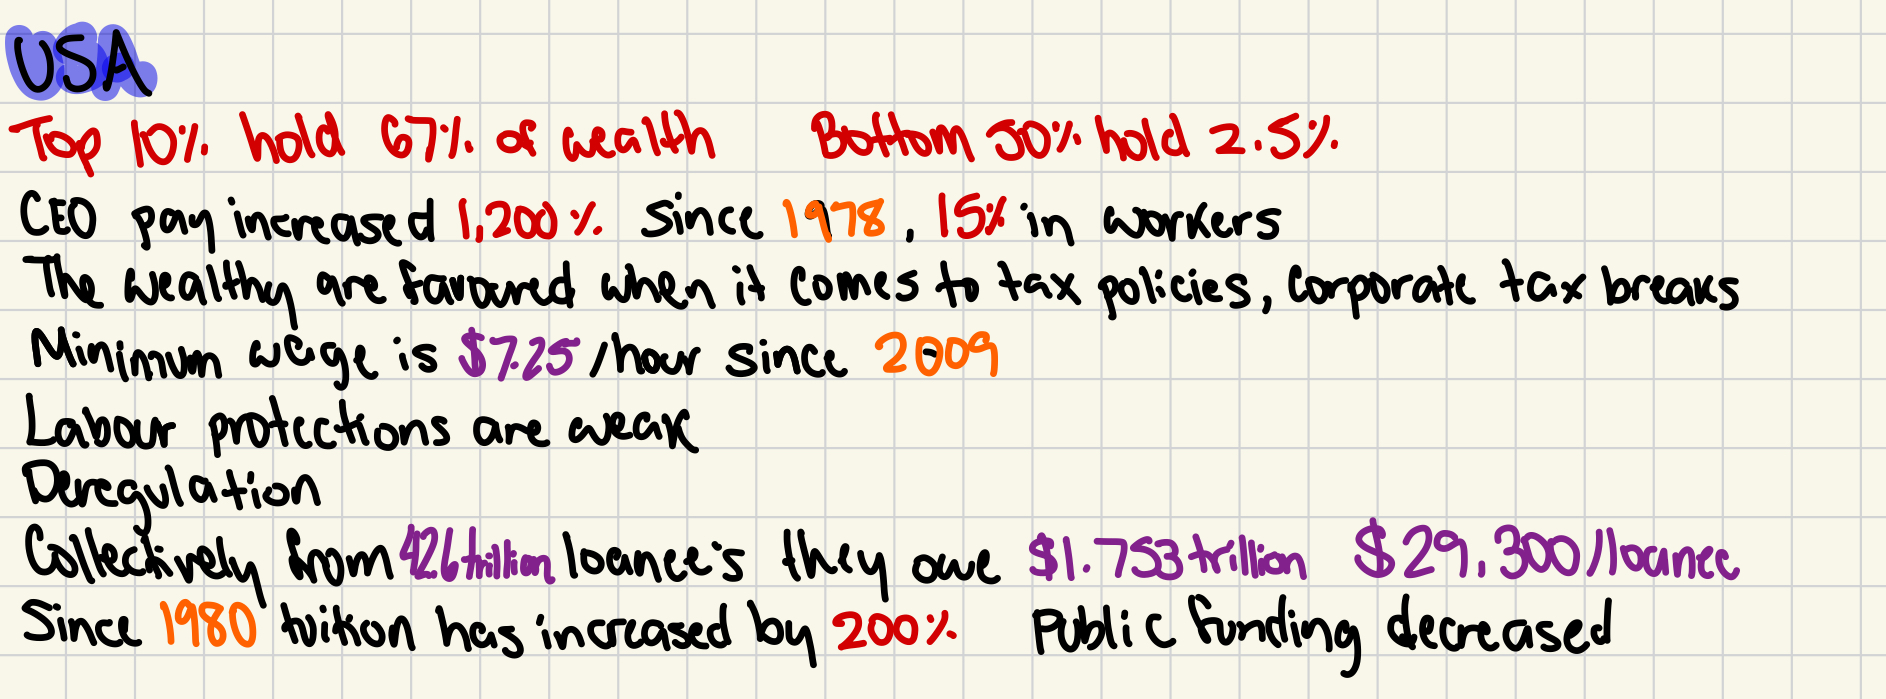
What are the statistics regarding wealth distribution and socioeconomic issues in the USA?

Understand the Problem
The question is presenting statistics regarding wealth distribution, CEO pay, minimum wage, labor protections, and student loan debt in the USA. It highlights disparities between different economic classes and trends over time, which can be relevant for discussions on economics and social justice.
Answer
Top 10% hold 67% of wealth; CEO pay up 1,200% since 1978; $7.25/hour minimum wage.
The top 10% in the USA hold 67% of wealth. CEO pay has increased by 1,200% since 1978, compared to a 15% increase for workers. Minimum wage is $7.25 since 2009. Student loan debt totals $1.753 trillion. Tuition increased 200% since 1980.
Answer for screen readers
The top 10% in the USA hold 67% of wealth. CEO pay has increased by 1,200% since 1978, compared to a 15% increase for workers. Minimum wage is $7.25 since 2009. Student loan debt totals $1.753 trillion. Tuition increased 200% since 1980.
More Information
CEO pay increases indicate growing disparities. The stagnant minimum wage and rising tuition highlight socioeconomic challenges.
Tips
A common mistake is assuming income inequality metrics fully represent wealth inequality. Wealth distribution includes assets, which can differ greatly from income distribution.
Sources
- The State of U.S. Wealth Inequality - St. Louis Fed - stlouisfed.org
- Trends in U.S. Income and Wealth Inequality - Pew Research Center - pewresearch.org
AI-generated content may contain errors. Please verify critical information