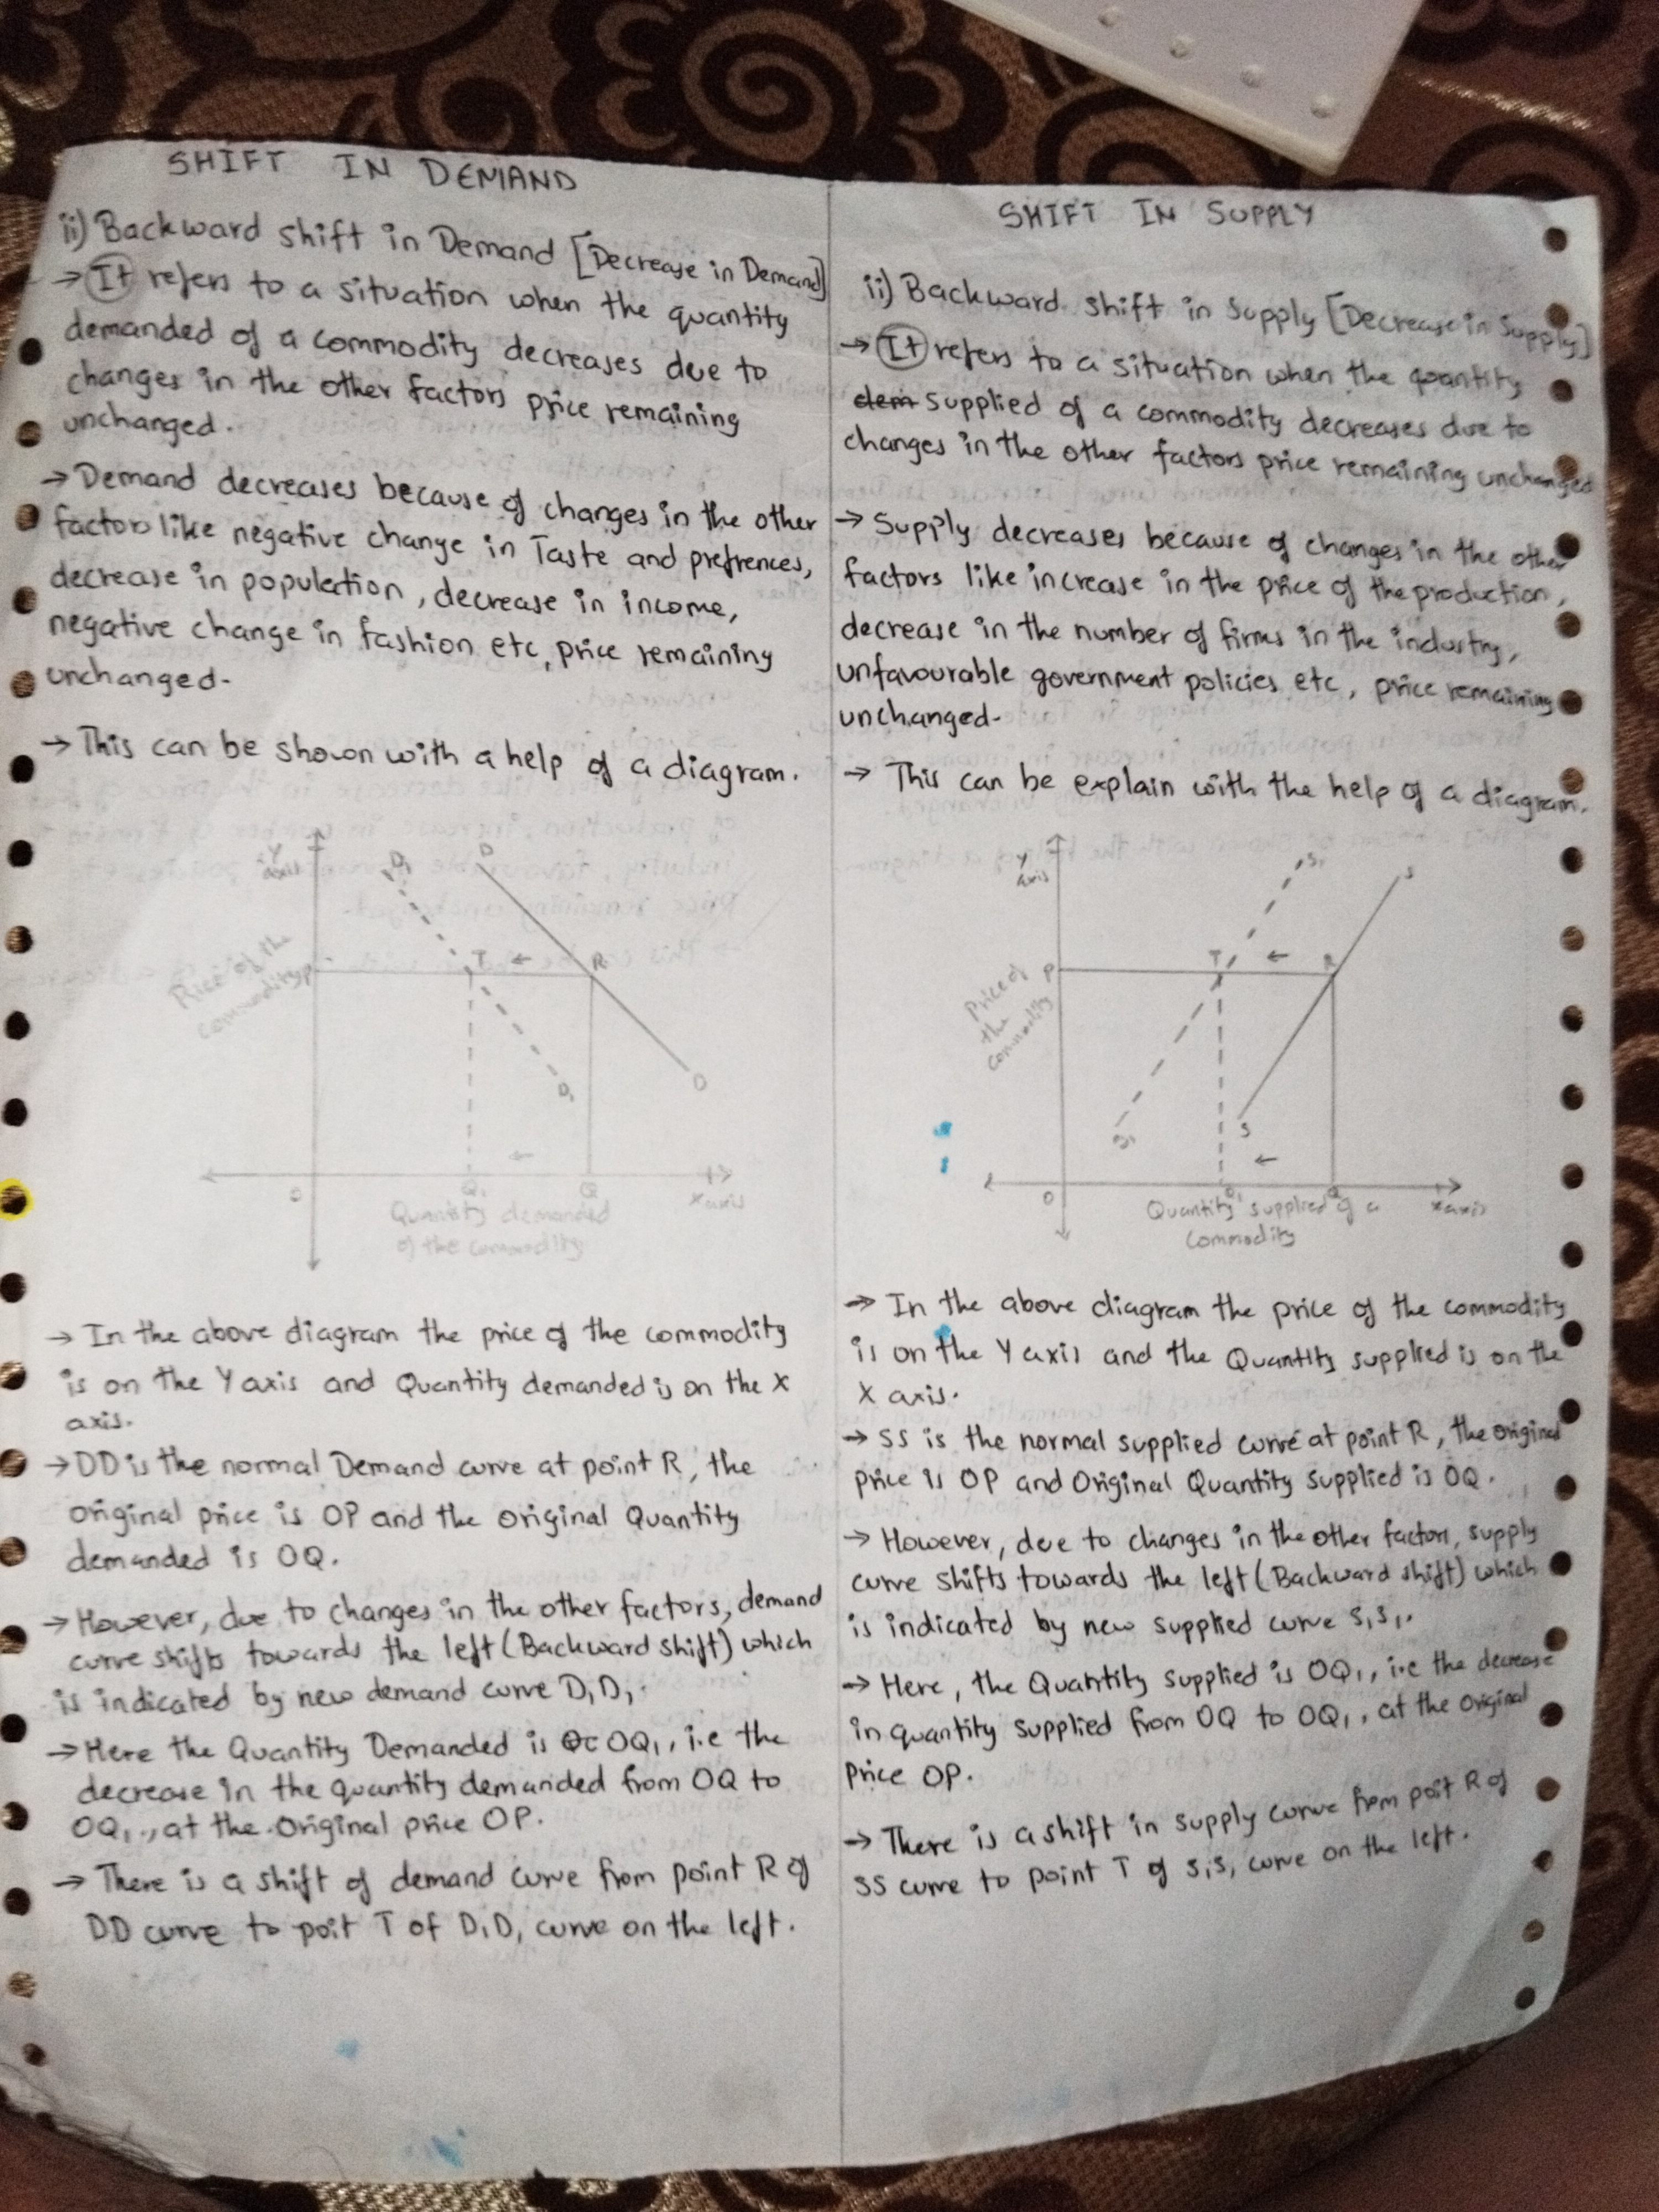
What are the backward shifts in demand and supply, and how can they be illustrated with diagrams?

Understand the Problem
The question is discussing the concepts of backward shifts in demand and supply in economics, illustrating how these shifts occur and affecting the price and quantity of commodities. It references diagrams to visually explain these shifts.
Answer
Leftward shifts in demand and supply show decreases.
Backward shifts in demand and supply represent decreases. They are illustrated by leftward shifts in the respective curves on a graph, showing reduced quantity at the same prices.
Answer for screen readers
Backward shifts in demand and supply represent decreases. They are illustrated by leftward shifts in the respective curves on a graph, showing reduced quantity at the same prices.
More Information
Shifts in curves are common tools in economics to visualize changes in market conditions like consumer preferences, technological advances, or policy changes.
Tips
Avoid confusing leftward shifts with decreases in prices; they represent a decrease in quantity demanded or supplied due to other factors.
Sources
- Shifts in Demand and Supply for Goods and Services - courses.lumenlearning.com
- What factors change demand? | Khan Academy - khanacademy.org
- What factors change supply? | Khan Academy - khanacademy.org
AI-generated content may contain errors. Please verify critical information